Make an 8-Bit Joshua Tree Climate Chart Poster
Chart a year of rain and heat in Joshua Tree as an 8-bit game screen in Lopsy, with dithered sky, pencil sprites, pattern-filled bars and pixel fonts.
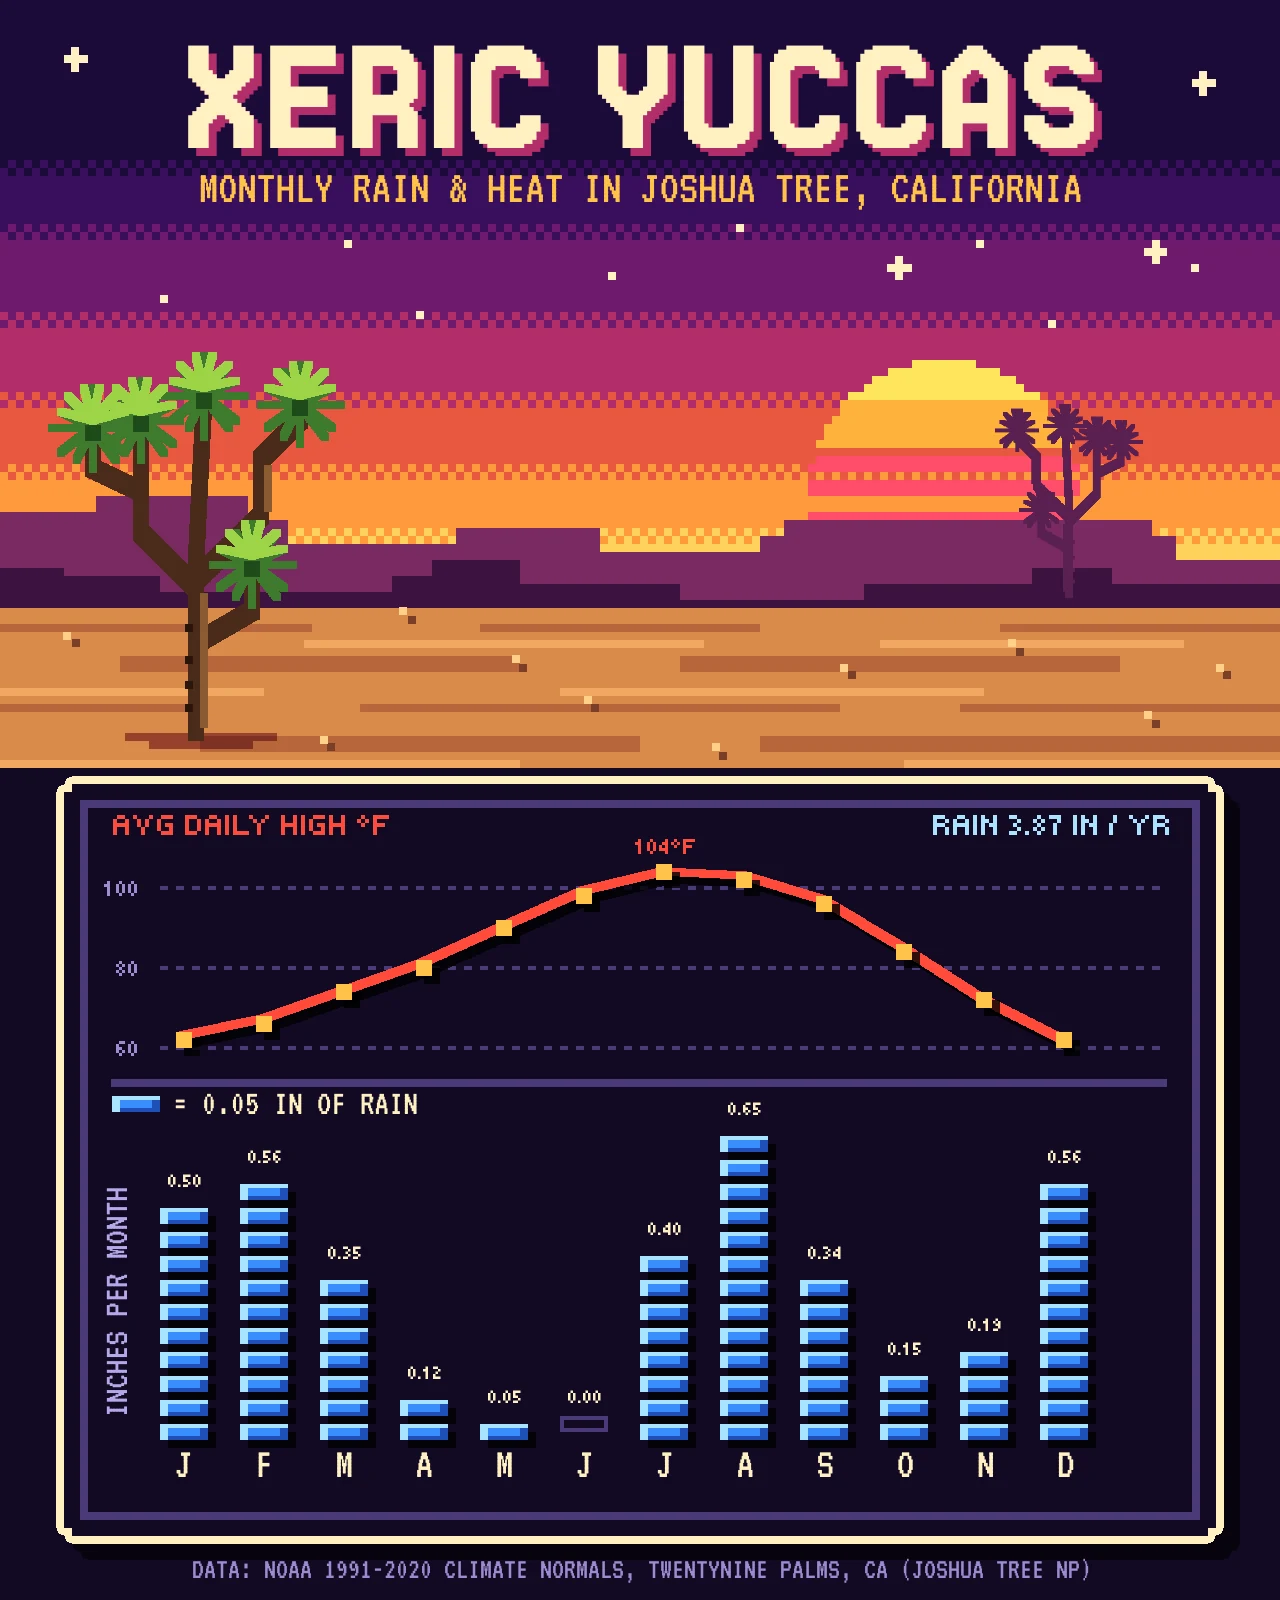
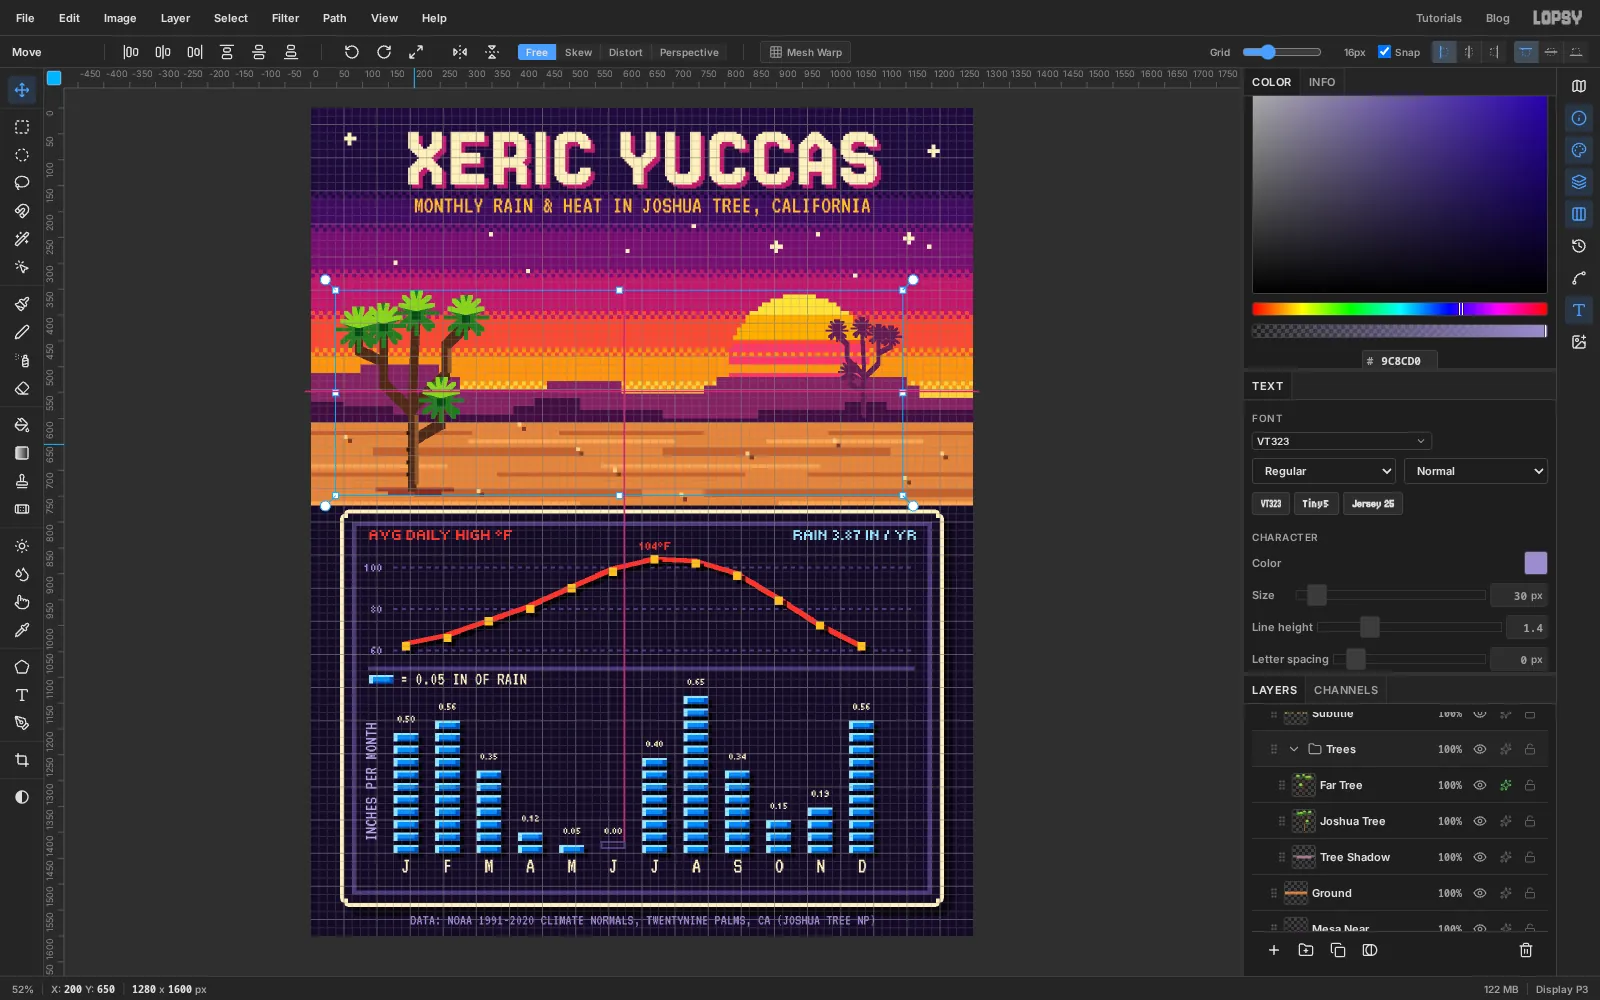
Joshua Tree National Park gets less than four inches of rain a year. That's what xeric means: adapted to a very dry place. The park's namesake yucca survives on it. This poster puts a year of that climate on one screen, styled like a level from an old 8-bit console. The top half is the stage: a desert at dusk. The bottom half is the HUD, with two charts that share one month axis.
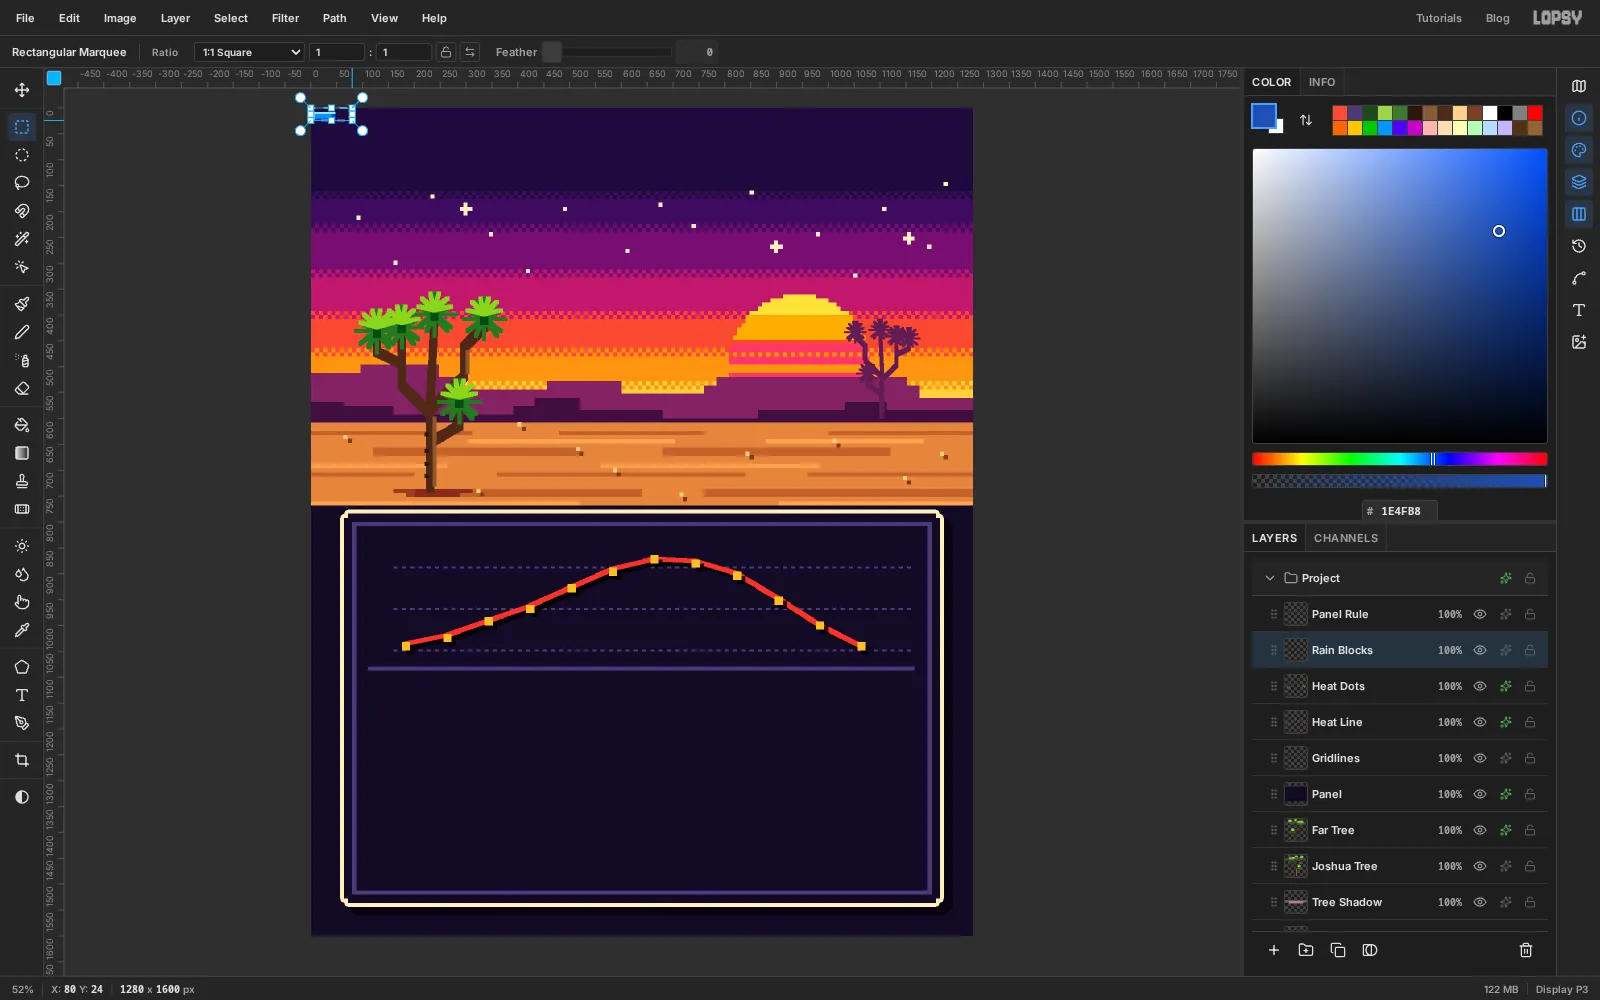
The data is real. It's the NOAA 1991–2020 climate normals for Twentynine Palms, the station at the park headquarters. The red line is the average daily high for each month. The blue stacks are average rainfall, counted in water blocks of 0.05 inches each.
Everything sits on an 8 px grid, so one grid cell is one "pixel" of the 8-bit picture. Marquees snap to it, and most shapes are built from rectangles.
The main things you'll learn:
- dithering flat colour bands with a checkerboard pattern and an intersected selection
- building pixel shapes from stacked marquees, stepped lassos and Pencil lines
- turning one drawn tree into a distant silhouette with Duplicate, Flip, scale and Color Overlay
- charting real numbers with a pattern tile sized to the chart, so every bar fills with whole blocks
- setting pixel fonts and lining a monospaced row up with chart columns using letter spacing
The palette:
-
Sky
-
Sun
-
Mesas
-
Sand
-
strata
-
pebbles
-
Yucca trunk
-
bark
-
leaves
-
Dead leaves
-
ground shadow
-
far tree
-
Window
-
rule and gridlines
-
border
-
Small type lavender
-
axis title
-
Heat line
-
coins
-
Rain blocks
-
highlight
-
shade
-
Set up the canvas and the 8 px grid
Create a new document
1280×1600px. Choose View → Show Grid. With the Rectangular Marquee (M) active, the grid controls appear at the right of the options bar. Drag the Grid slider to 8px and tick Snap.Click the
Backgroundlayer and fill it with the window colour, . It shows wherever nothing else is painted, so the gaps between chart elements stay dark.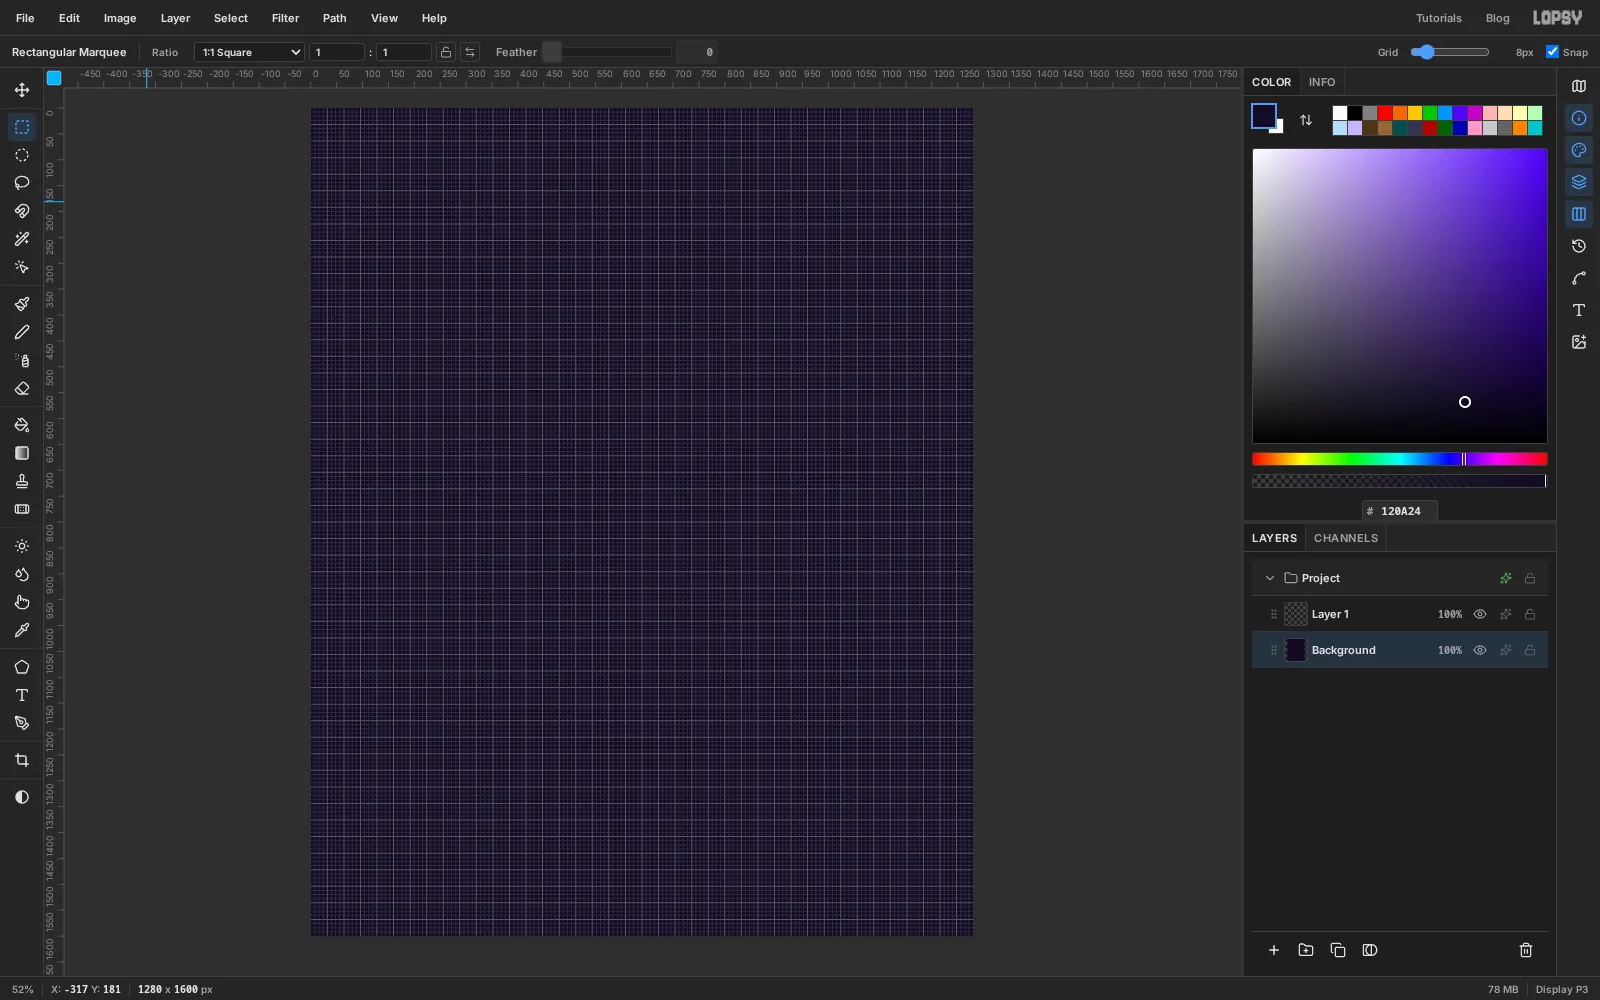
-
Paint the sky in flat bands
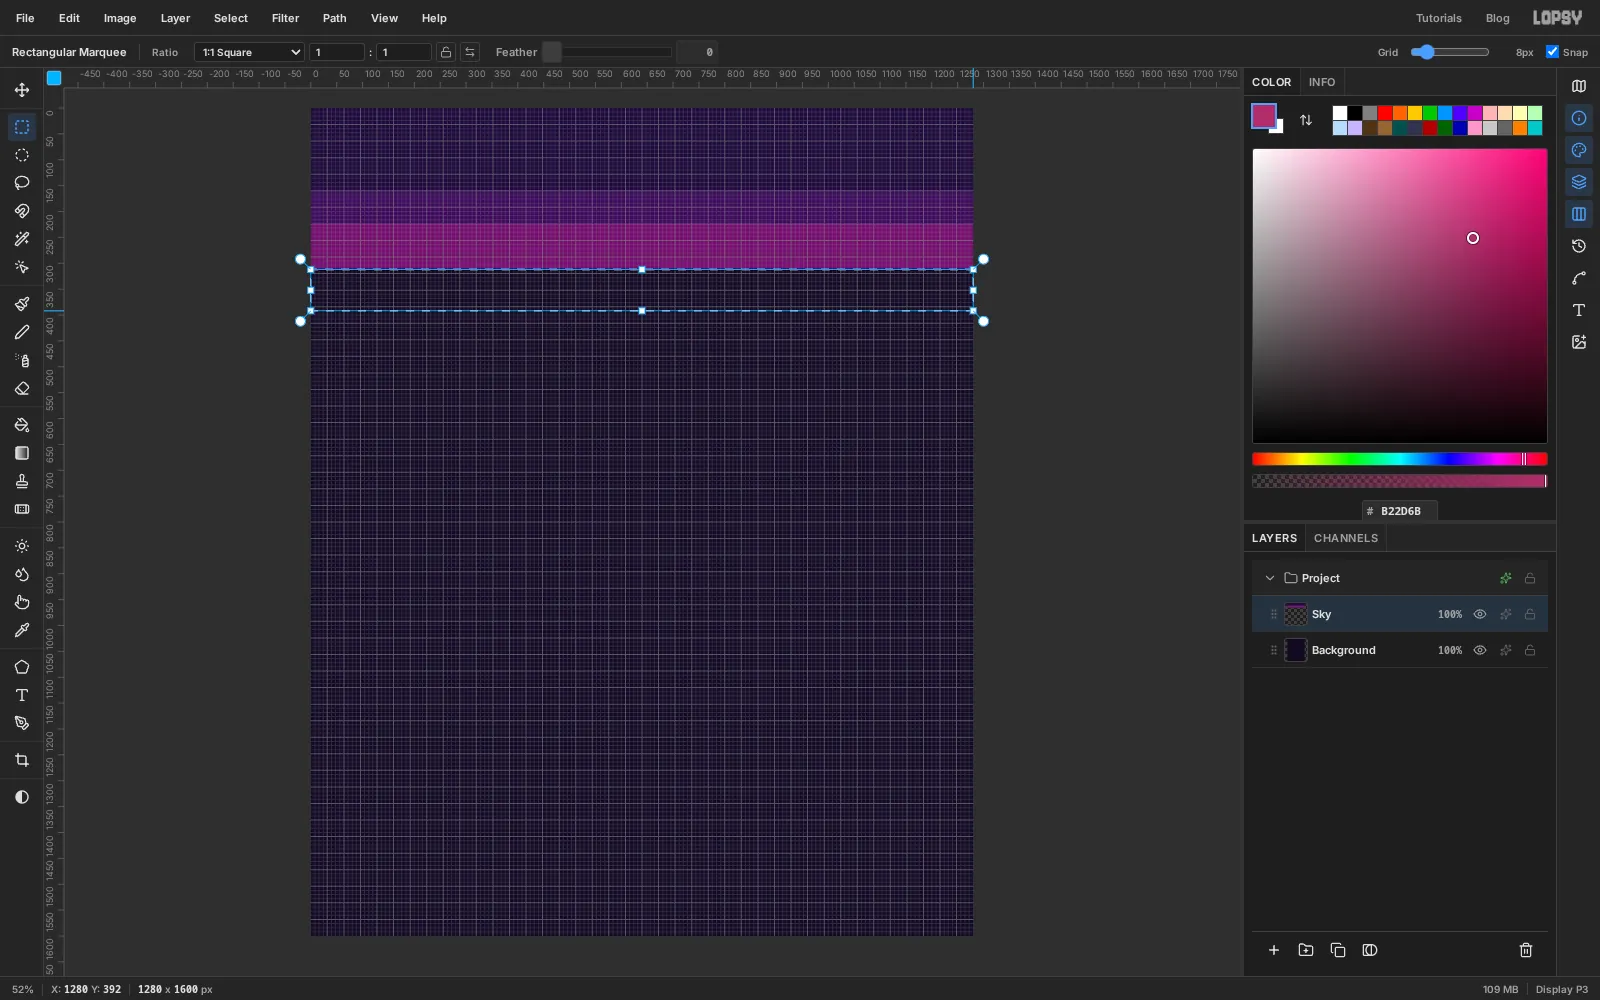
Old consoles couldn't draw smooth gradients, so the dusk sky is seven flat bands. Rename
Layer 1toSky. For each band, drag a marquee across the full width of the canvas and fill it:- from the top down to y
160. This band is tall on purpose: the title sits in it. - from
160to232 - from
232to312 - from
312to392 - from
392to464 - from
464to528 - from
528to608
Deselect when you're done.
- from the top down to y
-
Make a checkerboard pattern
A checkerboard is the classic way to blend two flat colours in pixel art. You'll use it as a stencil.
- Add a layer named
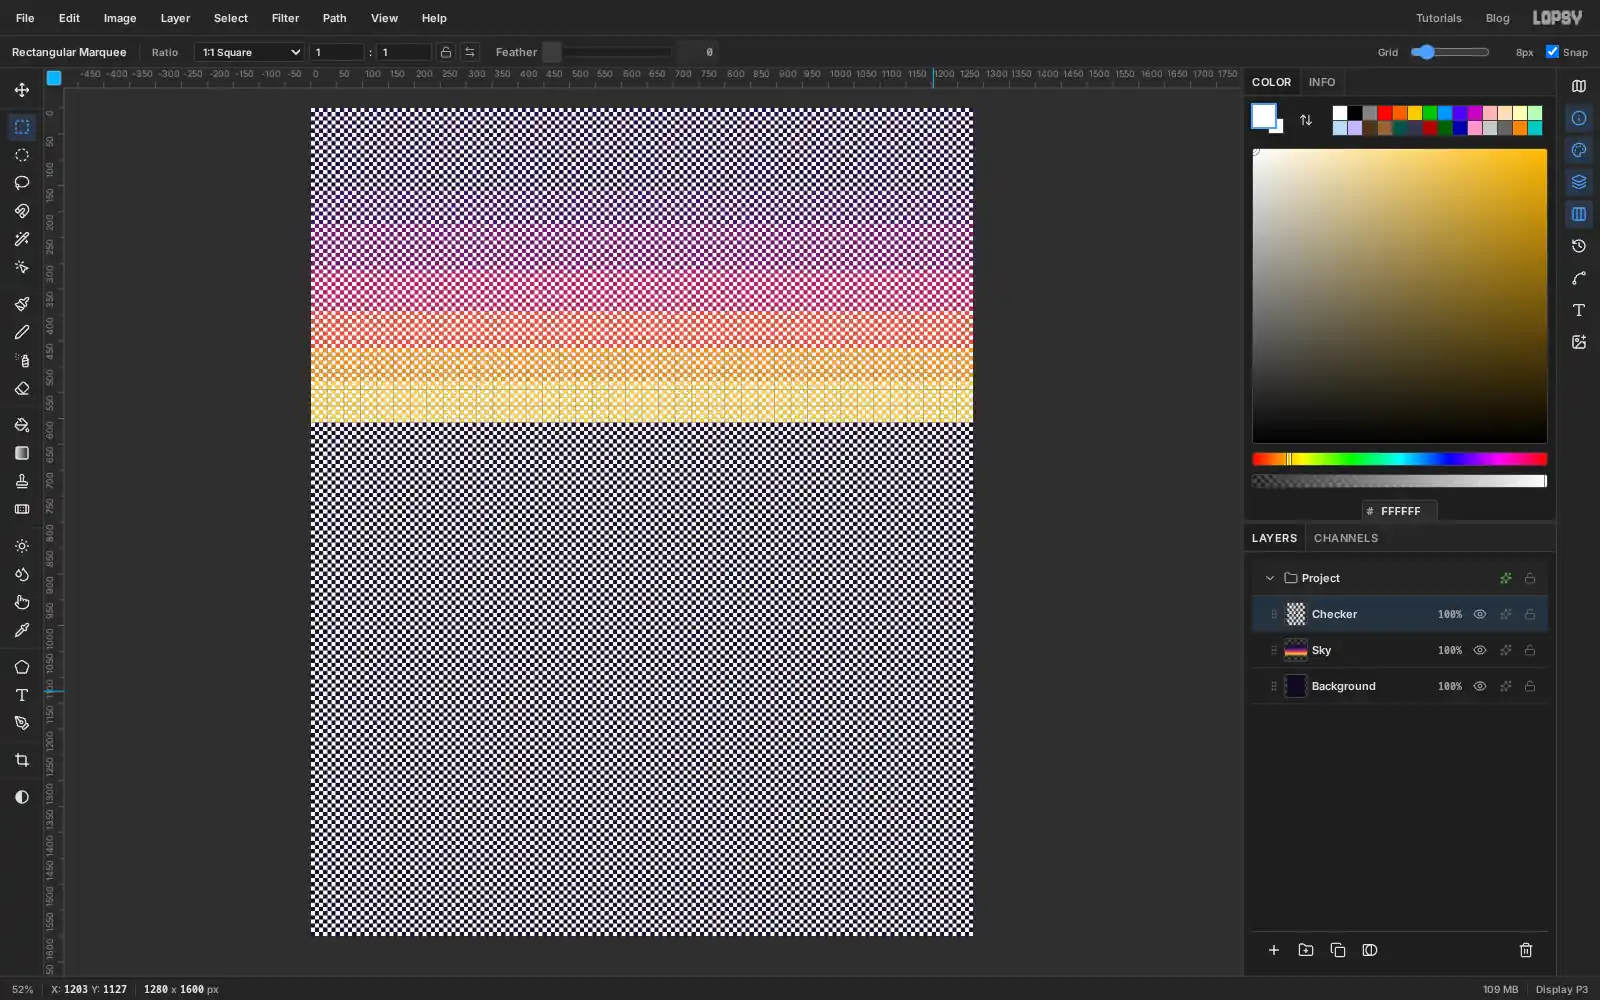
Checker. In the top-left corner, fill one grid cell white (0, 0to8, 8), and the cell diagonally below it (8, 8to16, 16). - Select the 16 × 16 square around both cells and choose Edit → Define Pattern.
- Select all (Cmd+A), press Delete and deselect.
- Choose Edit → Fill with Pattern… and click Apply with your new pattern.
The checkerboard covers the whole layer. Pattern fills line up with the canvas's top-left corner, so every check sits exactly on the grid.
- Add a layer named
-
Dither the seams between bands
Now blend each seam. You work on the
Skylayer but borrow the checker's pixels as a selection.For each seam, starting with the one at
160:- The checker covers the whole canvas while you work. That's fine; it's only a stencil. Click the
Skylayer and drag a marquee across the full width, two cells (16 px) tall, at the top of the lower band. For the first seam that's160to176. - Hold Cmd+Shift+Alt and click the
Checkerlayer's thumbnail. That intersects the strip with the checker, so only every other cell stays selected. - Fill with the colour of the band above the seam.
Repeat for the seams at
232,312,392,464and528. When they're all done, delete theCheckerlayer.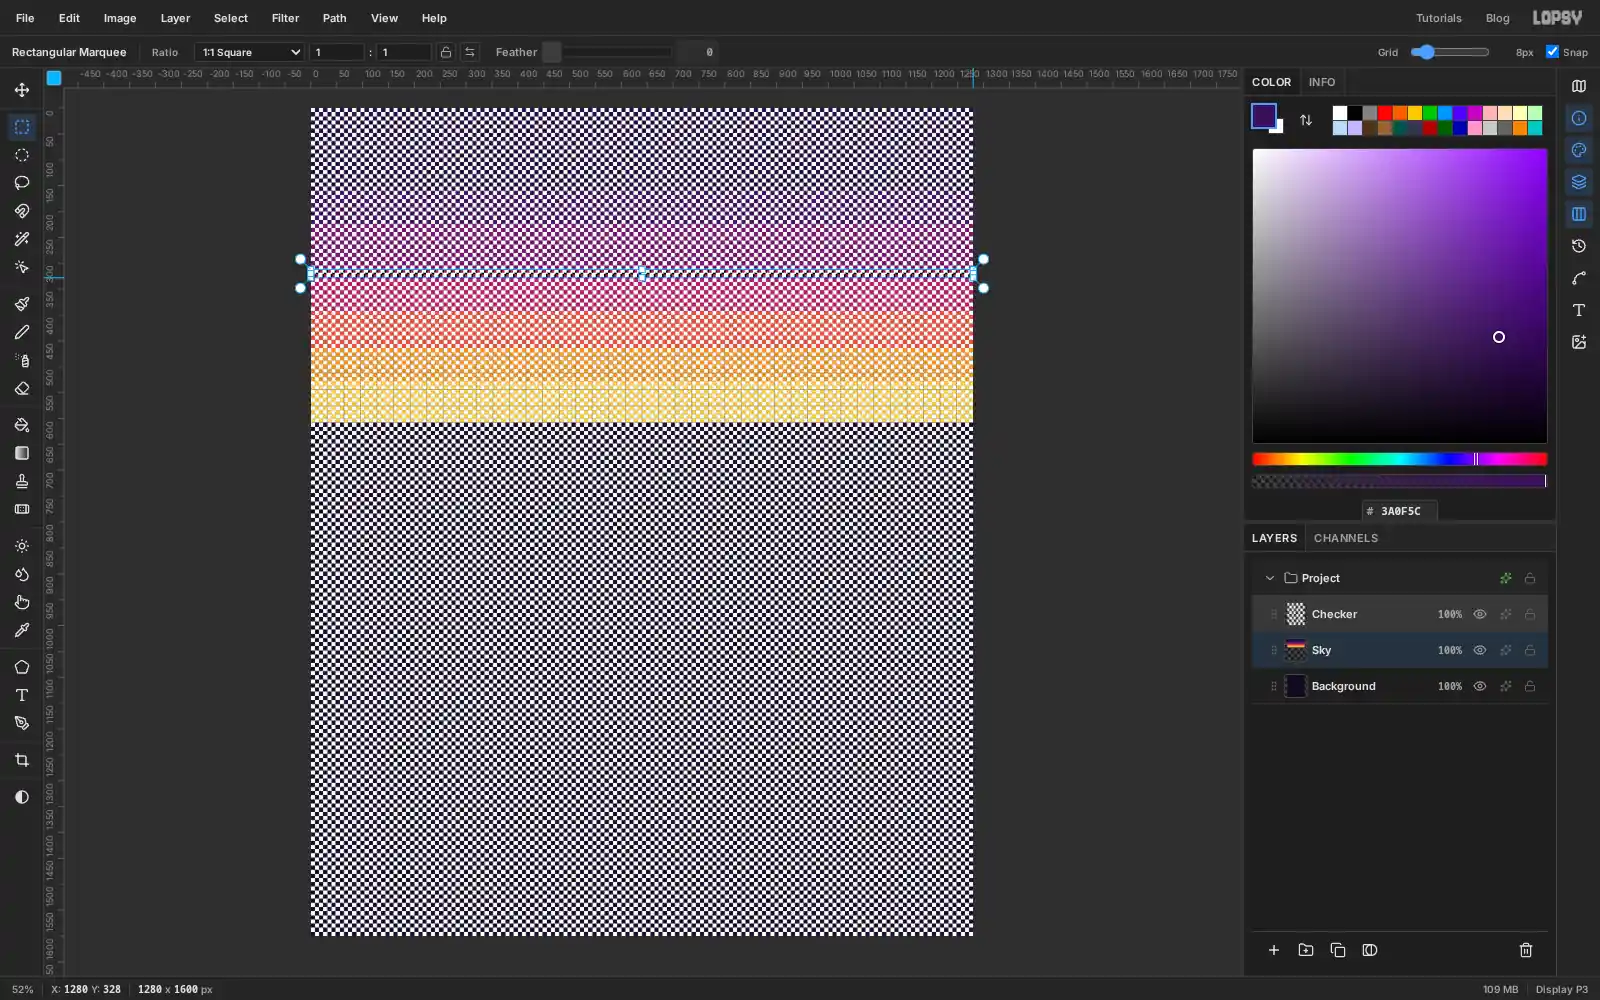
- The checker covers the whole canvas while you work. That's fine; it's only a stencil. Click the
-
Scatter pixel stars
Add a layer named
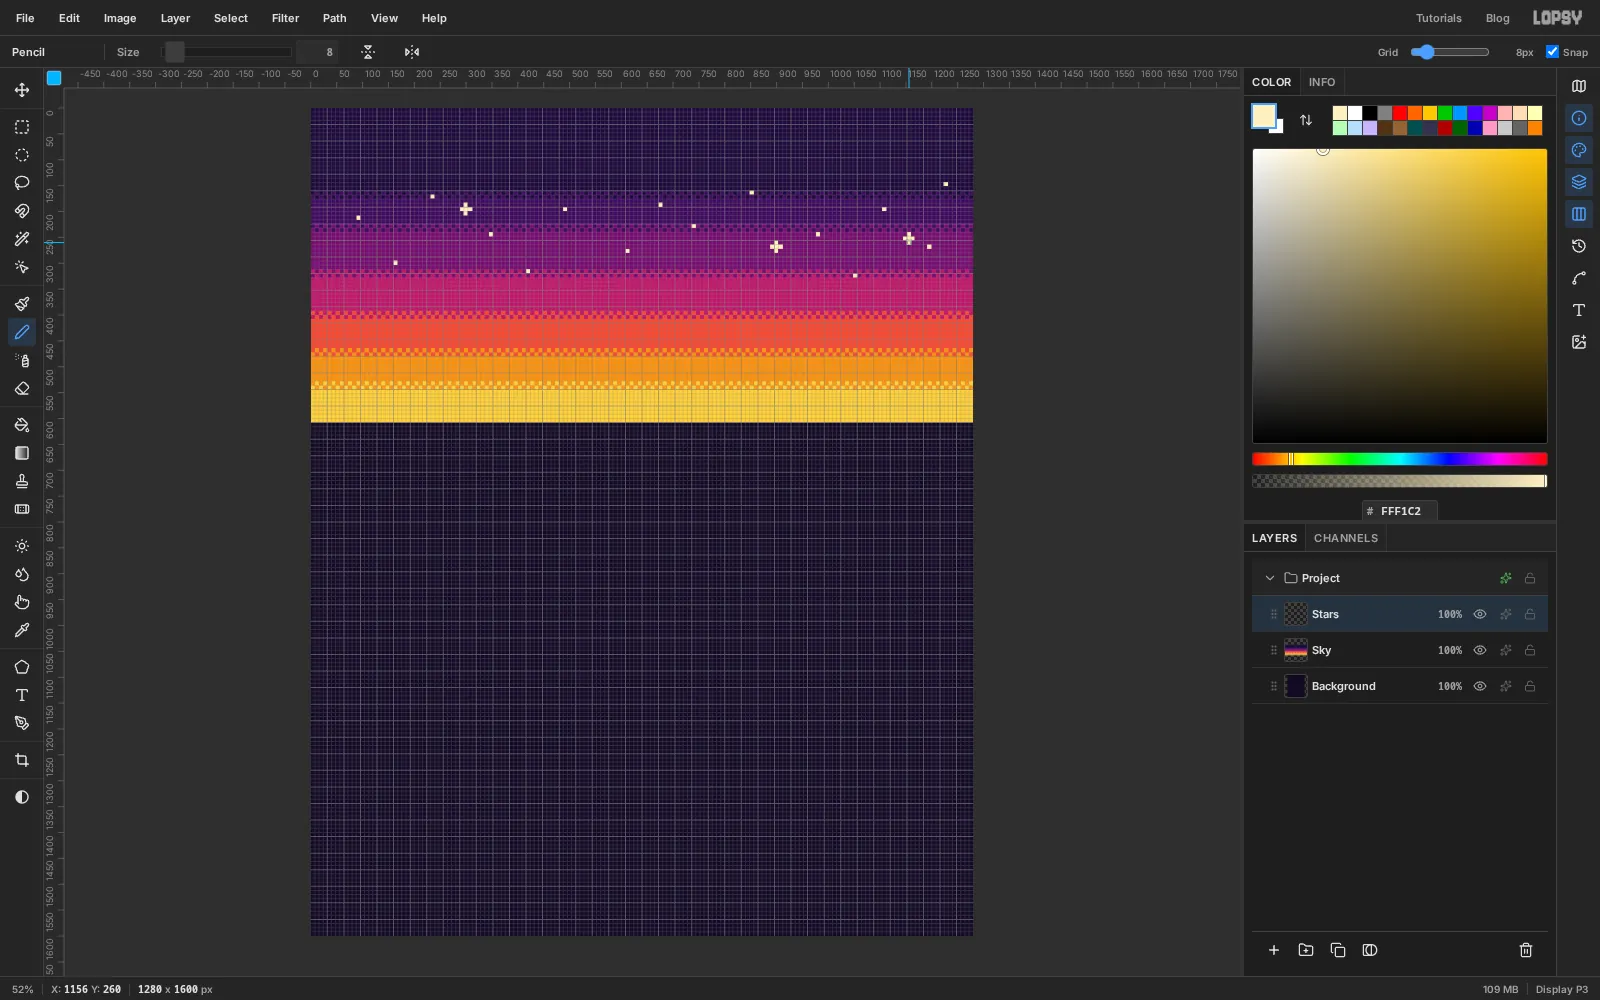
Stars. Pick the Pencil (N) and set its Size to8, so a click paints a block the size of one grid cell. Click near the middle of a cell so the block lines up with the grid. Set the colour to cream and click about fifteen single stars into the upper three bands, keeping them away from each other.For a few brighter stars, draw a plus: click one cell left of the centre, then Shift-click one cell right of it. Then click one cell above and Shift-click one cell below. Shift-click draws a straight line from the last point.
Don't worry about stars near the top. You'll clean up around the title later.
Now hide the grid with View → Show Grid. From here on some pieces are half a cell thick, and Snap only works while the grid is showing, so hiding it lets you draw them. You'll turn it back on at the end.
-
Build the sun from rows
A pixel circle is a stack of rows, each a little wider than the one above. Add a layer named
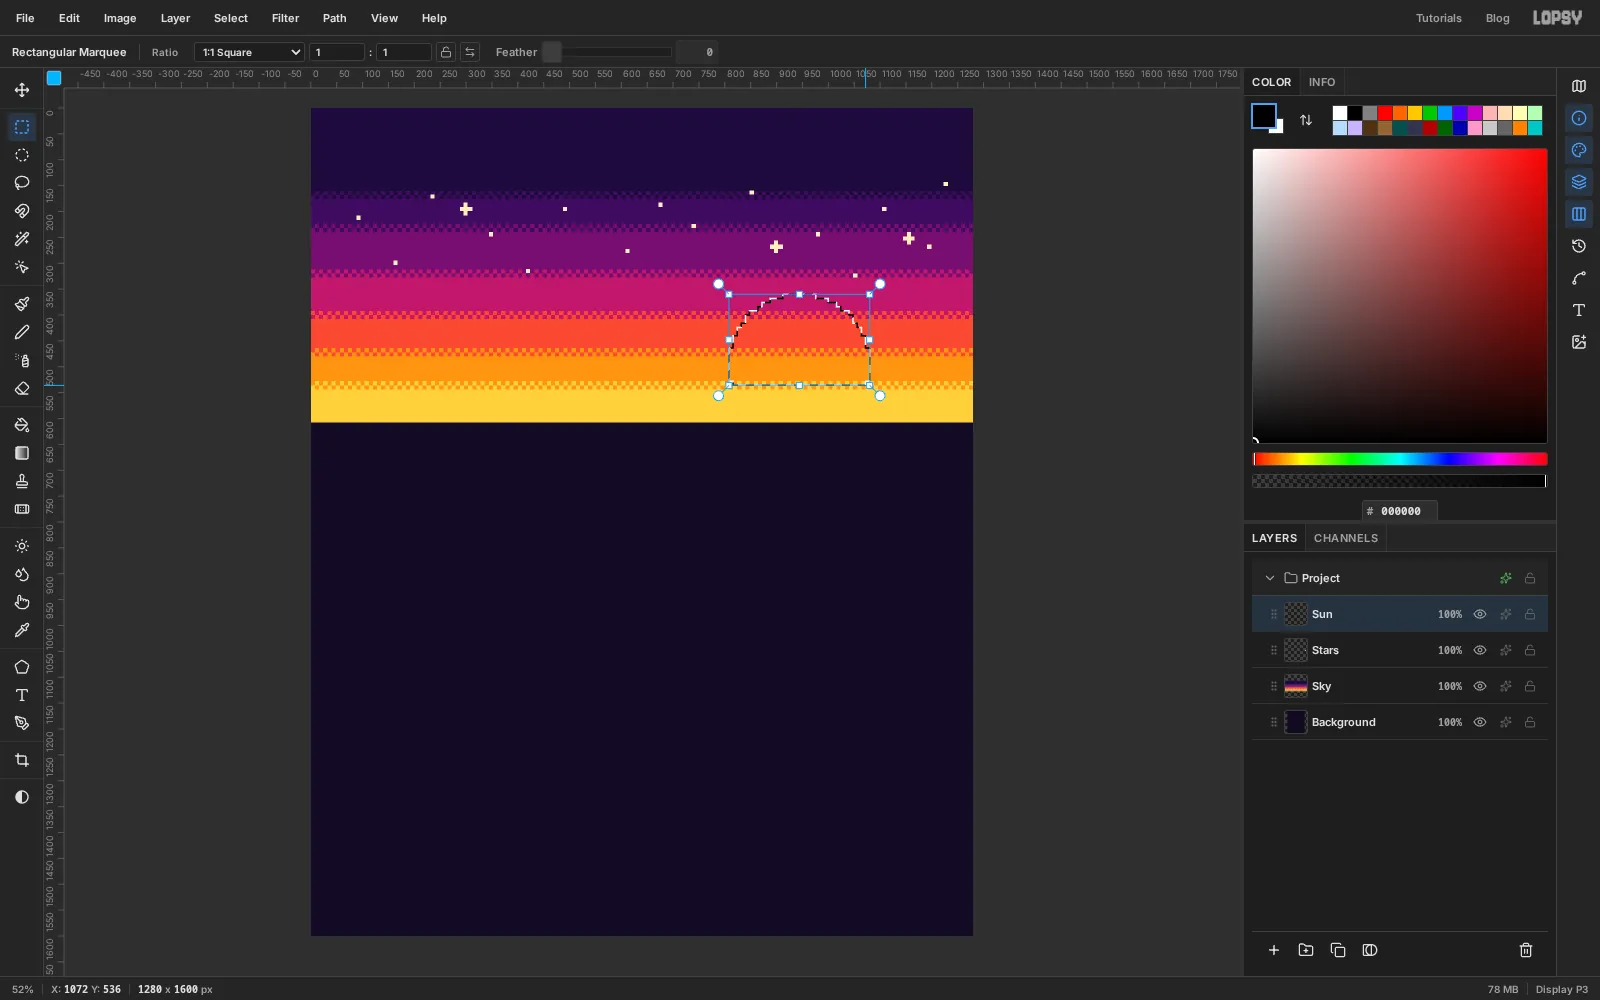
Sun. The sun is centred at944, 496with a radius of 136 px, and only its top shows above the mesas.Drag the top row first, then hold Shift and drag each row below it. Every row is centred on x
944. From the top down:360–368: 64 px wide368–376: 112 px376–384: 144 px384–392: 160 px392–400: 192 px400–416: 208 px416–424: 224 px424–440: 240 px440–464: 256 px464–528: 272 px (the full width)
Rows near the top widen quickly and rows near the middle barely change, which is what makes it read as round. Below
528the mesas will cover it.Fill the whole selection with the deepest sun colour, coral .
-
Band and stripe the sun
Give the sun paler bands at the top, using the same intersect trick as the sky:
- Drag a marquee from just above the sun down to y
400. Cmd+Shift+Alt-click theSunthumbnail so only the sun is selected, and fill it yellow . - Drag from
400to448, intersect with theSunthumbnail again, and fill it amber .
Now cut the stripes that make it a retro sun. Shift-drag three horizontal strips across the sun, a little wider than it: one cell tall at
448and at472, and two cells tall at496. Press Delete and deselect. The stripes get thicker towards the horizon, which makes the sun look like it's sinking.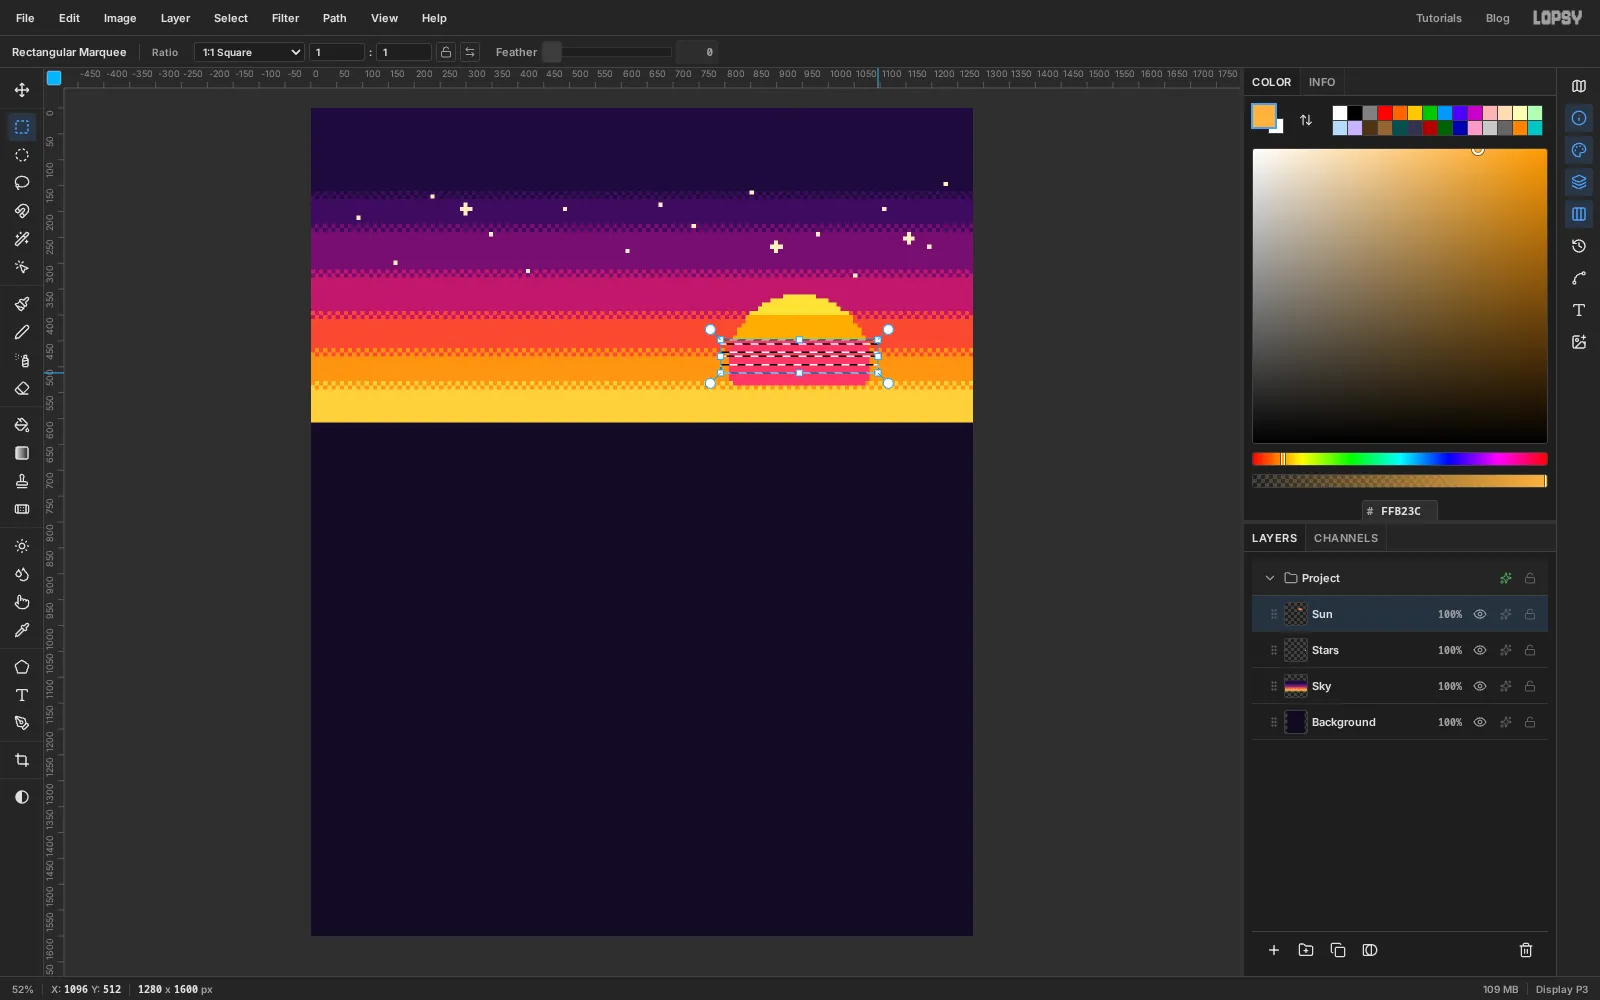
- Drag a marquee from just above the sun down to y
-
Lasso the stepped mesas
Mesas are flat-topped, so in pixel art they're just steps. Add a layer named
Mesa Far. With the Lasso (L), drag a path that only moves straight across or straight up and down, one or two cells at a time. Start off the left edge at y600, climb to about500, then step along the horizon, and come back down off the right edge. The tops should sit between496and560. Close the loop along the bottom.Fill it with plum .
Add a layer named
Mesa Nearand do the same lower down, with the tops between560and600. Fill it with dark plum . The darker, lower range reads as closer.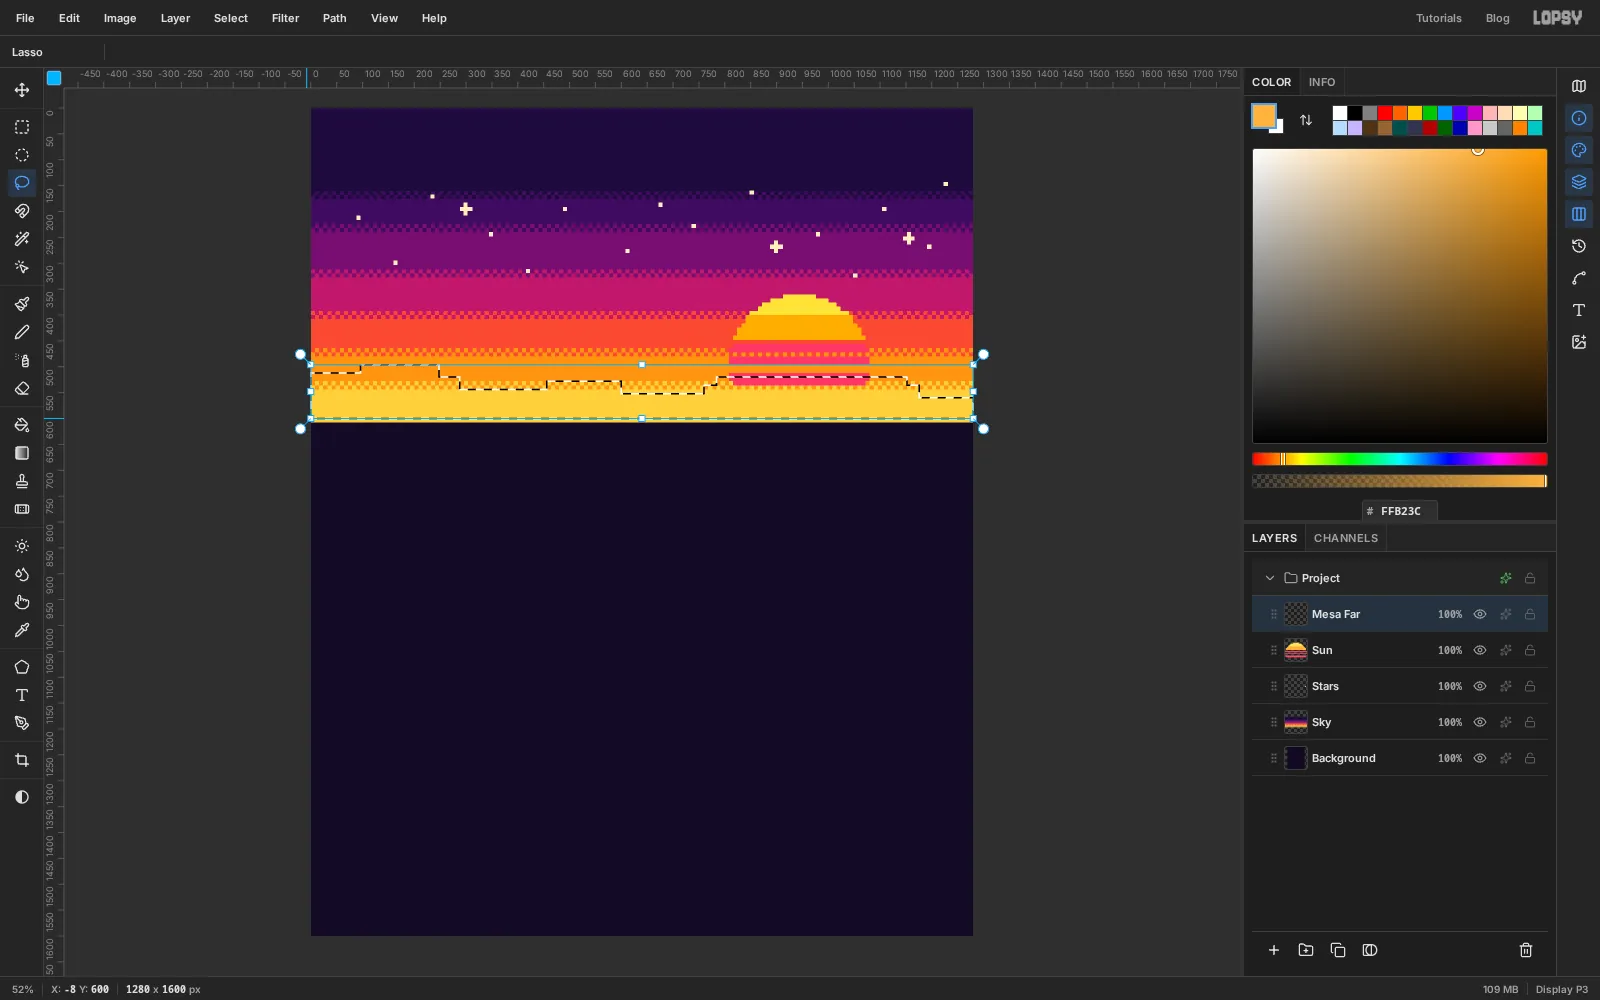
-
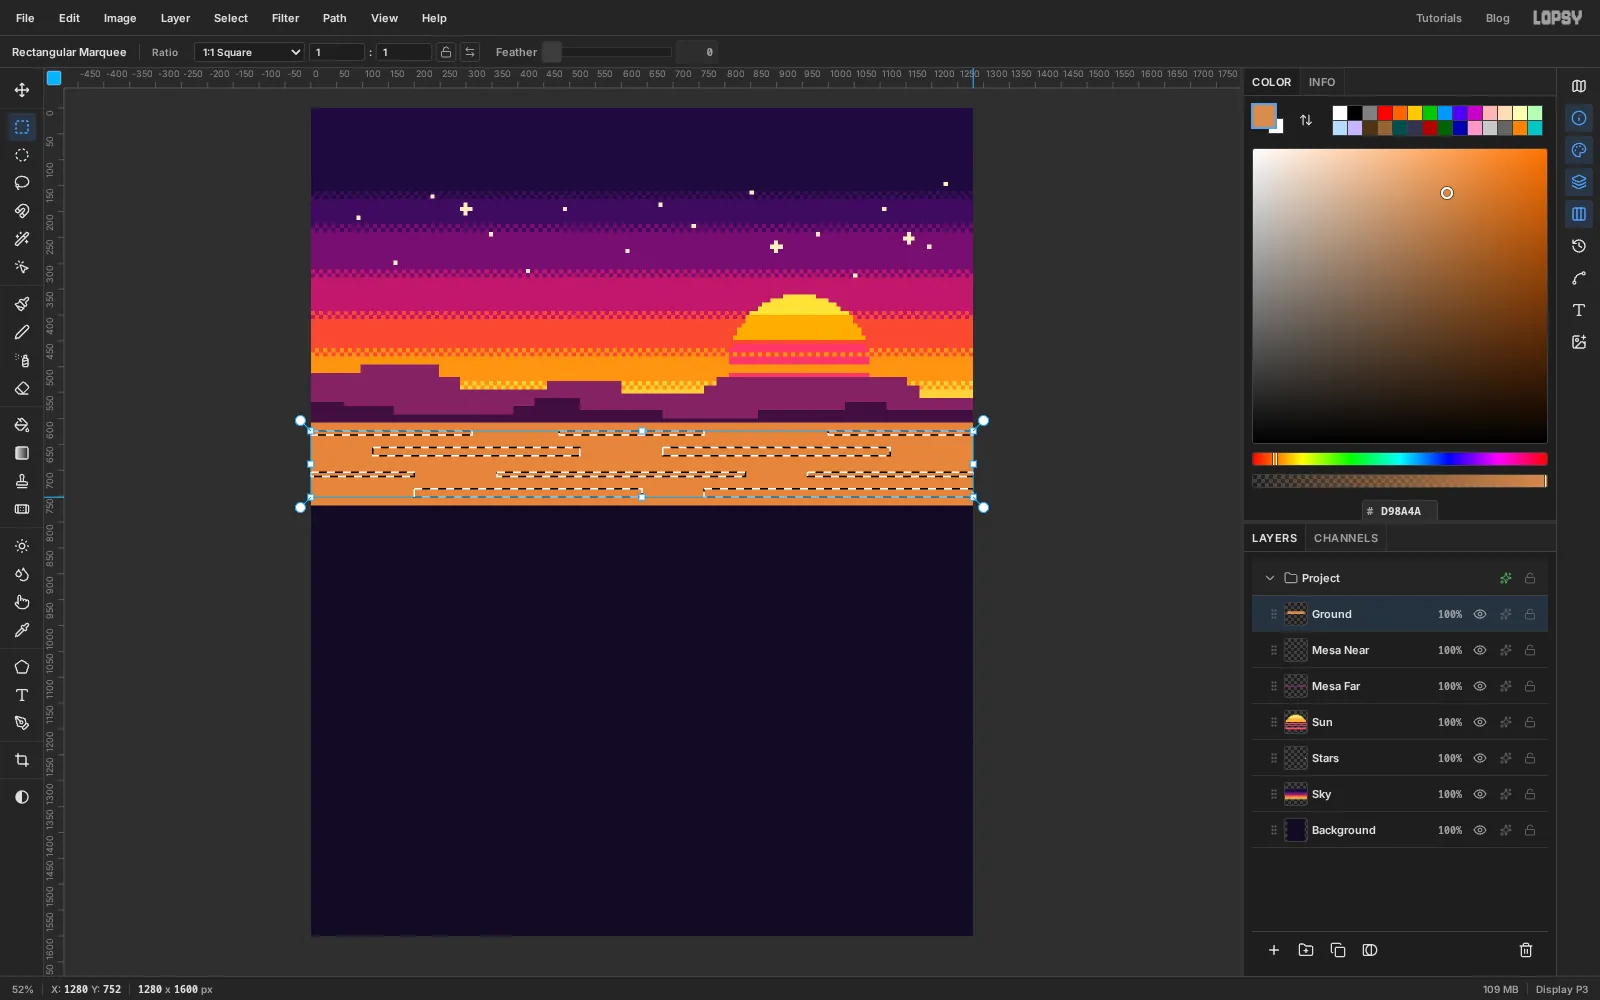
Lay down the sand
Add a layer named
Ground. Select from0, 608to the right edge at768and fill it with sand .Desert sand in 8-bit games is drawn as long flat strata. Build the darker strata as one selection: drag a first strip, then Shift-drag the others. Make them one or two cells tall and between 200 and 500 px long, staggered so no two line up. Leave gaps between rows. Fill them with .
Do the same with a few shorter strips in the gaps, and fill those with pale sand .
-
Scatter pebbles
Deselect. With the Pencil at size
8, click about ten pebbles across the sand in . Then switch to and click one cell up and to the left of each pebble. That one highlight cell makes each pebble look round, with light coming from the top left.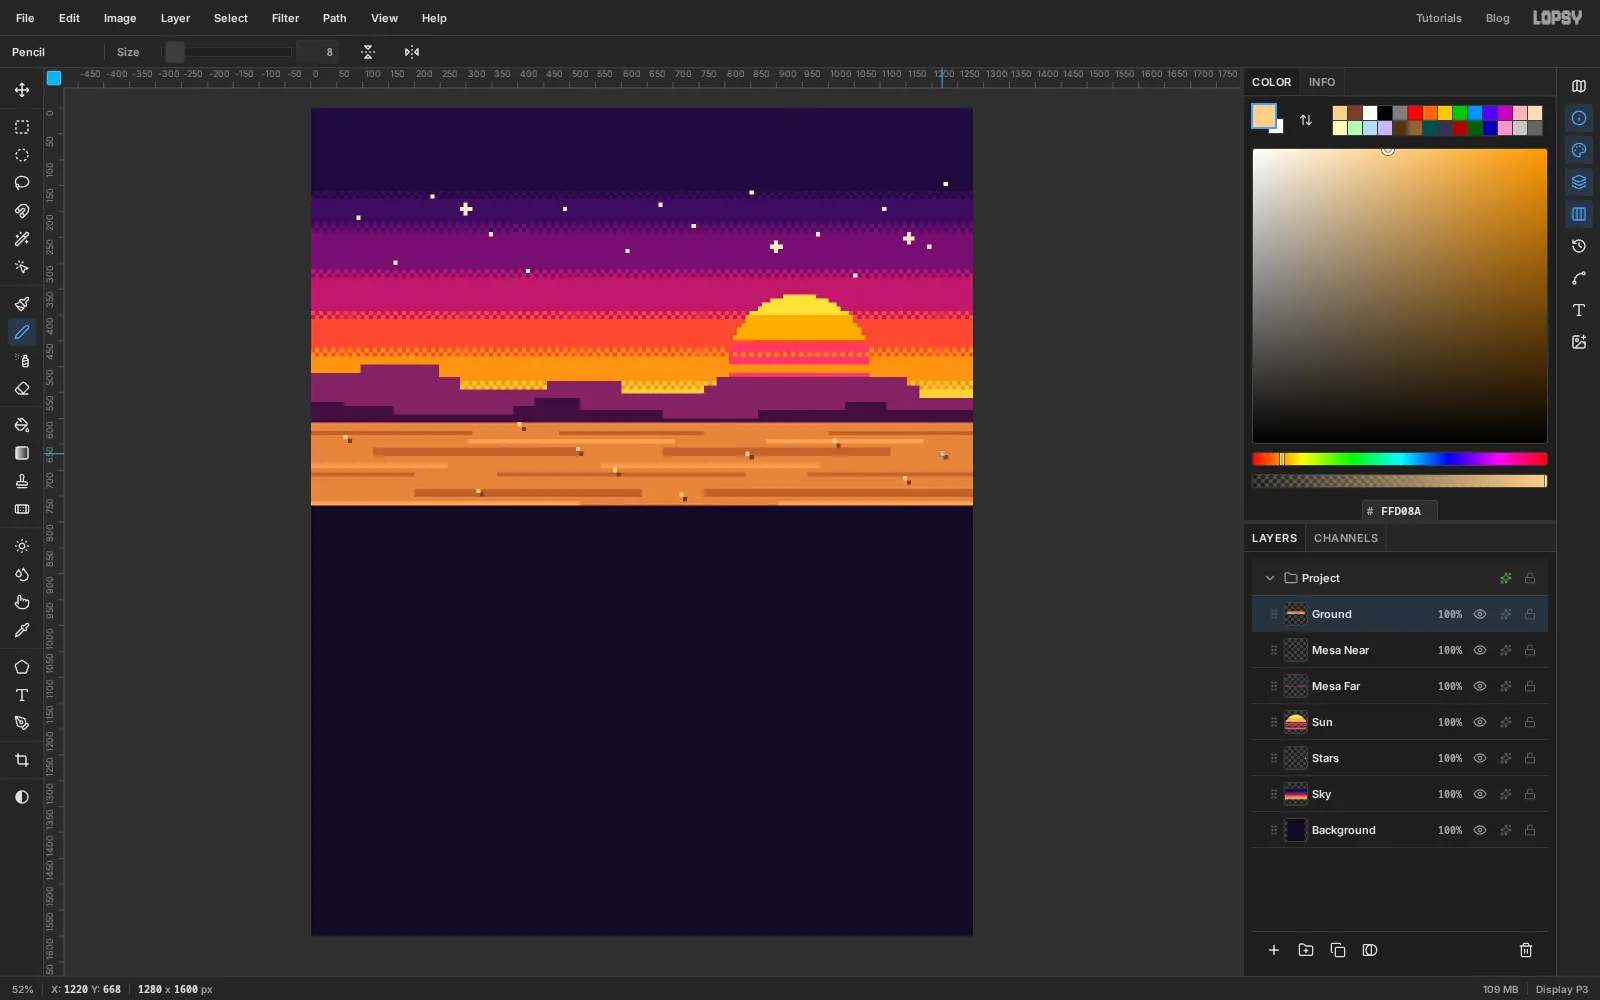
-
Draw the Joshua tree's limbs
First, a ground shadow. Click
Groundand add a layer namedTree Shadow. Select a strip one cell tall from160, 736to312, 744, then Shift-add a shorter strip under it (184, 744to288, 752). Fill with , deselect, and set the layer's blend mode to Multiply in its effects drawer. Multiply darkens the sand under it instead of covering it.Add a layer named
Joshua Treeabove it. Pick the Pencil, set Size to16and the colour to trunk brown . Draw the limbs as click-and-Shift-click chains. A Joshua tree's arms go up, kink, and go up again:- The trunk, from
232, 736straight up to232, 576. - A left arm from
232, 592up and left to176, 536, then straight up to176, 440. Add a short side arm off it to128, 472and up to128, 448. - A right arm from
232, 584to296, 520, up to296, 464, then out to336, 424. - A centre arm from the top of the trunk up to
240, 416. - A low arm from
232, 648to288, 616and up to288, 584.
Drop the size to
8. Draw a lighter bark line down the right side of the trunk in , then click a few dark marks down its left side. These are the dead leaves that hang on a real Joshua tree's trunk.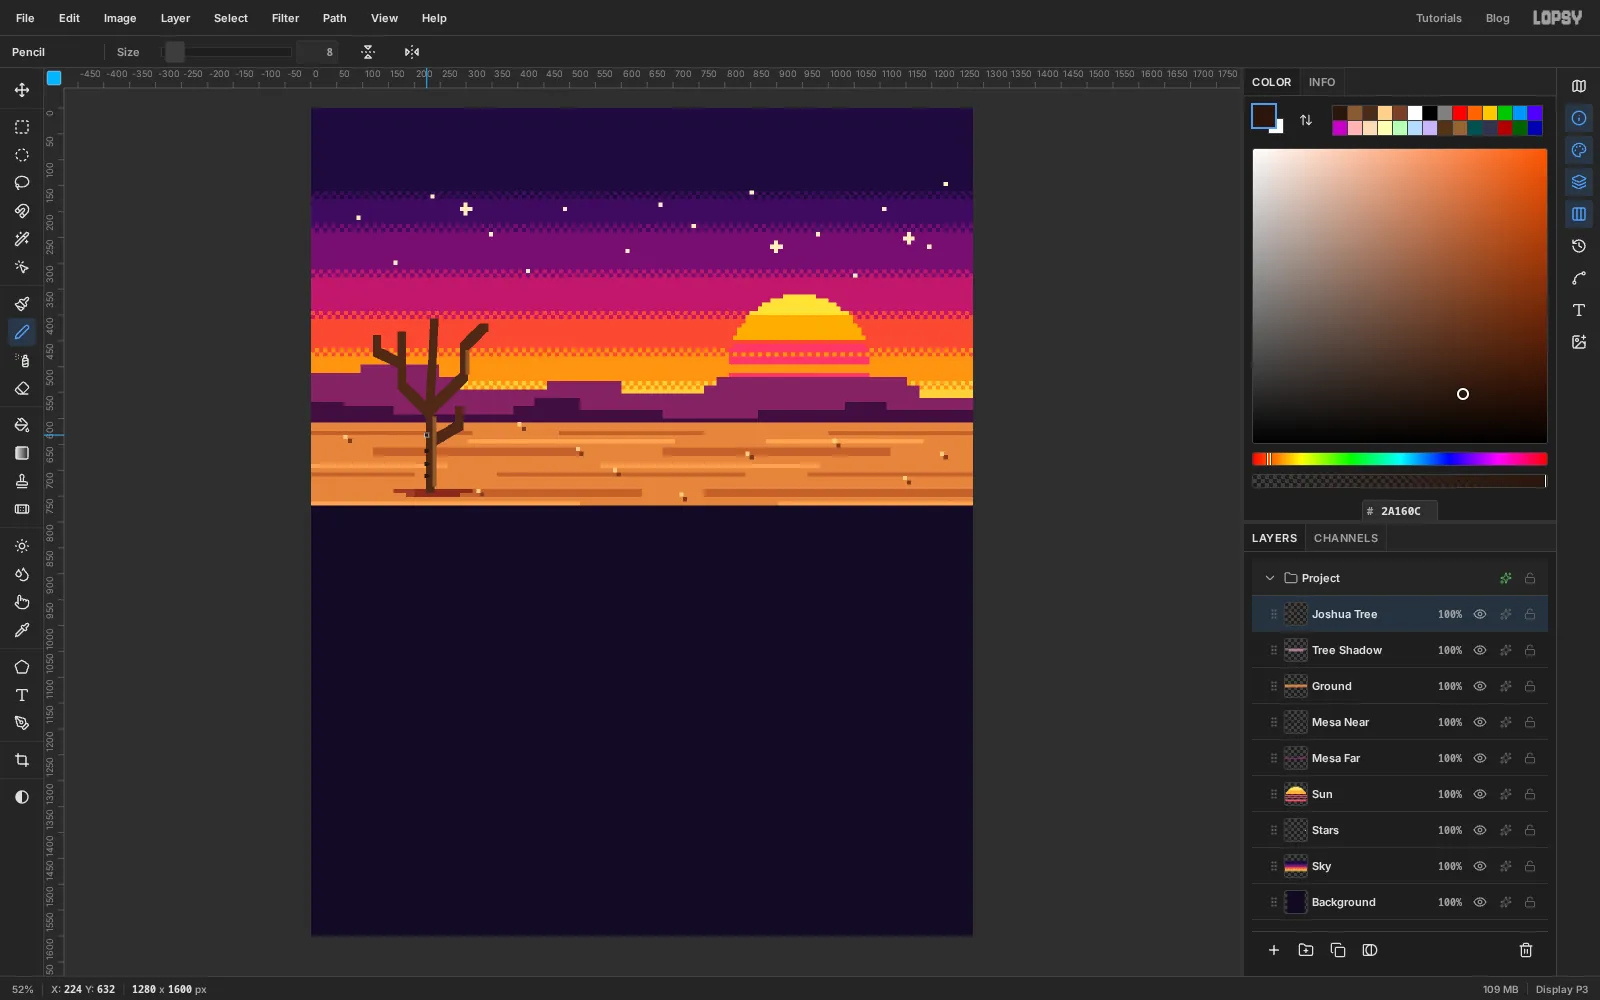
- The trunk, from
-
Add the spiky leaf rosettes
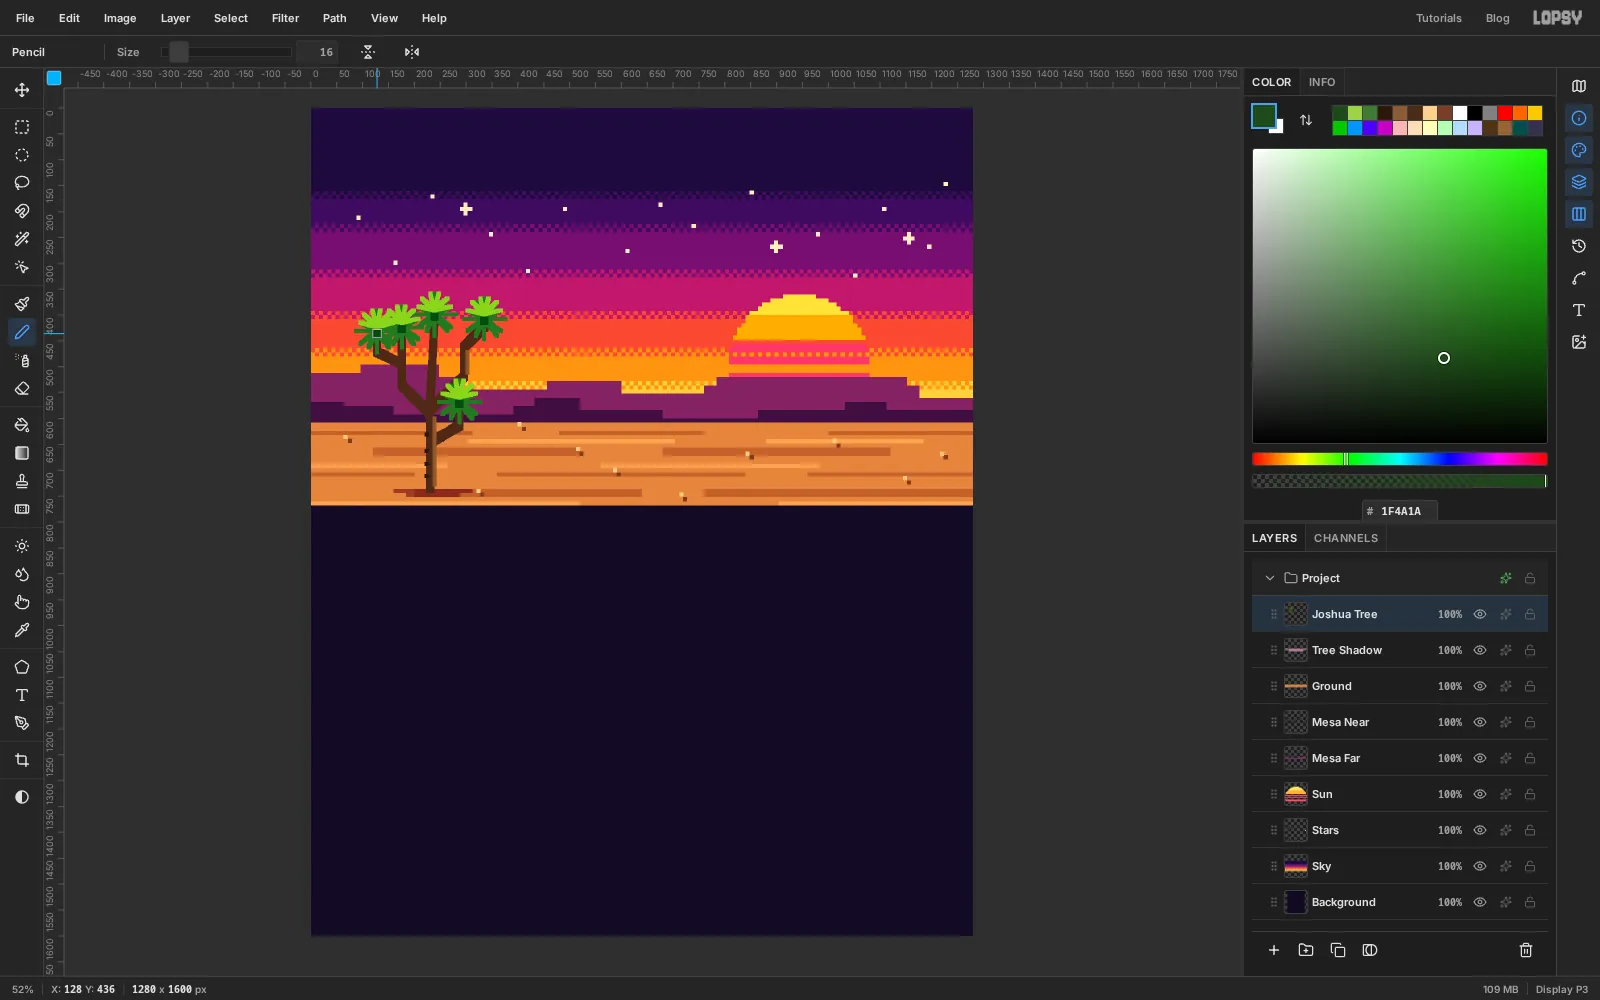
Joshua tree leaves grow in spiky balls at the ends of the arms. Draw each one as a starburst with the Pencil at size
8:- In dark green , click the end of an arm, then Shift-click about five cells away. Click the centre again and Shift-click in another direction. Go all the way round, one spike every 30° or so, twelve spikes in all.
- Switch to light green and add shorter spikes on the top half only, starting one cell above the centre. The light top makes the rosette look lit from above.
- Set the size to
16and click a dark core into the middle.
Do this at each of the five arm tips.
-
Duplicate, flip and shrink a second tree
A second, distant tree balances the sun.
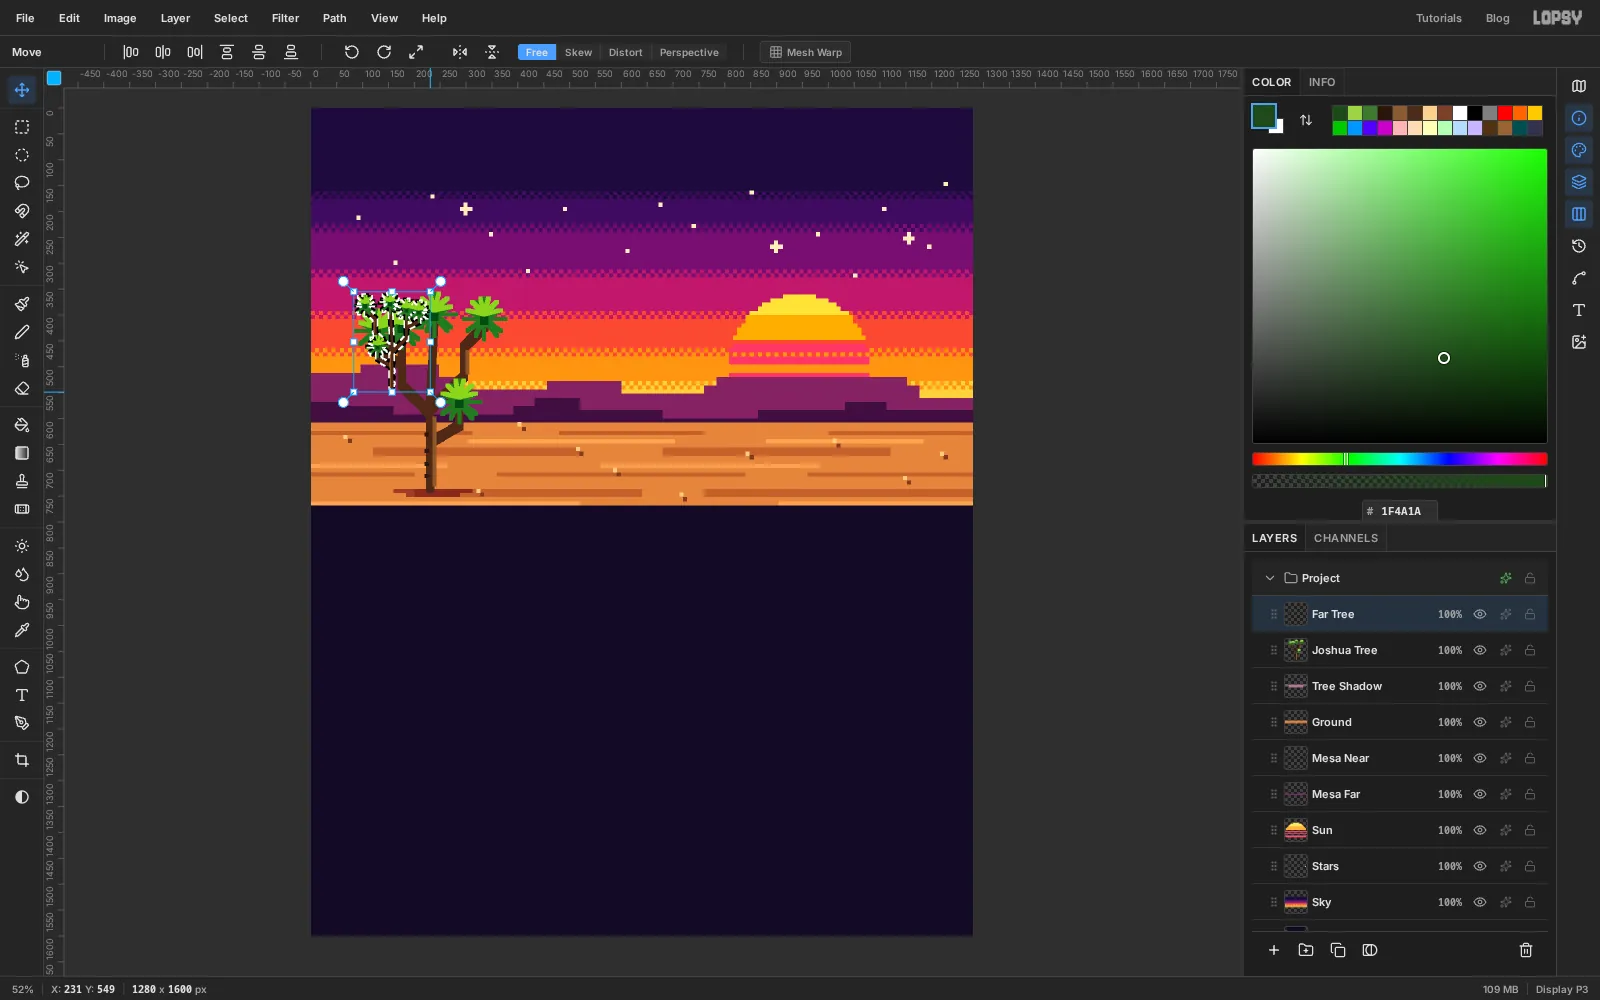
- With
Joshua Treeselected, click Duplicate Layer in the Layers panel and rename the copyFar Tree. - Choose Image → Flip Horizontal. The copy mirrors in place.
- Cmd-click the
Far Treethumbnail to select its pixels. Switch to the Move tool (V), hold Cmd and drag the bottom-right handle up and to the left until the tree is half its height. Cmd keeps the proportions. Press Enter to apply and deselect.
- With
-
Turn it into a distant silhouette
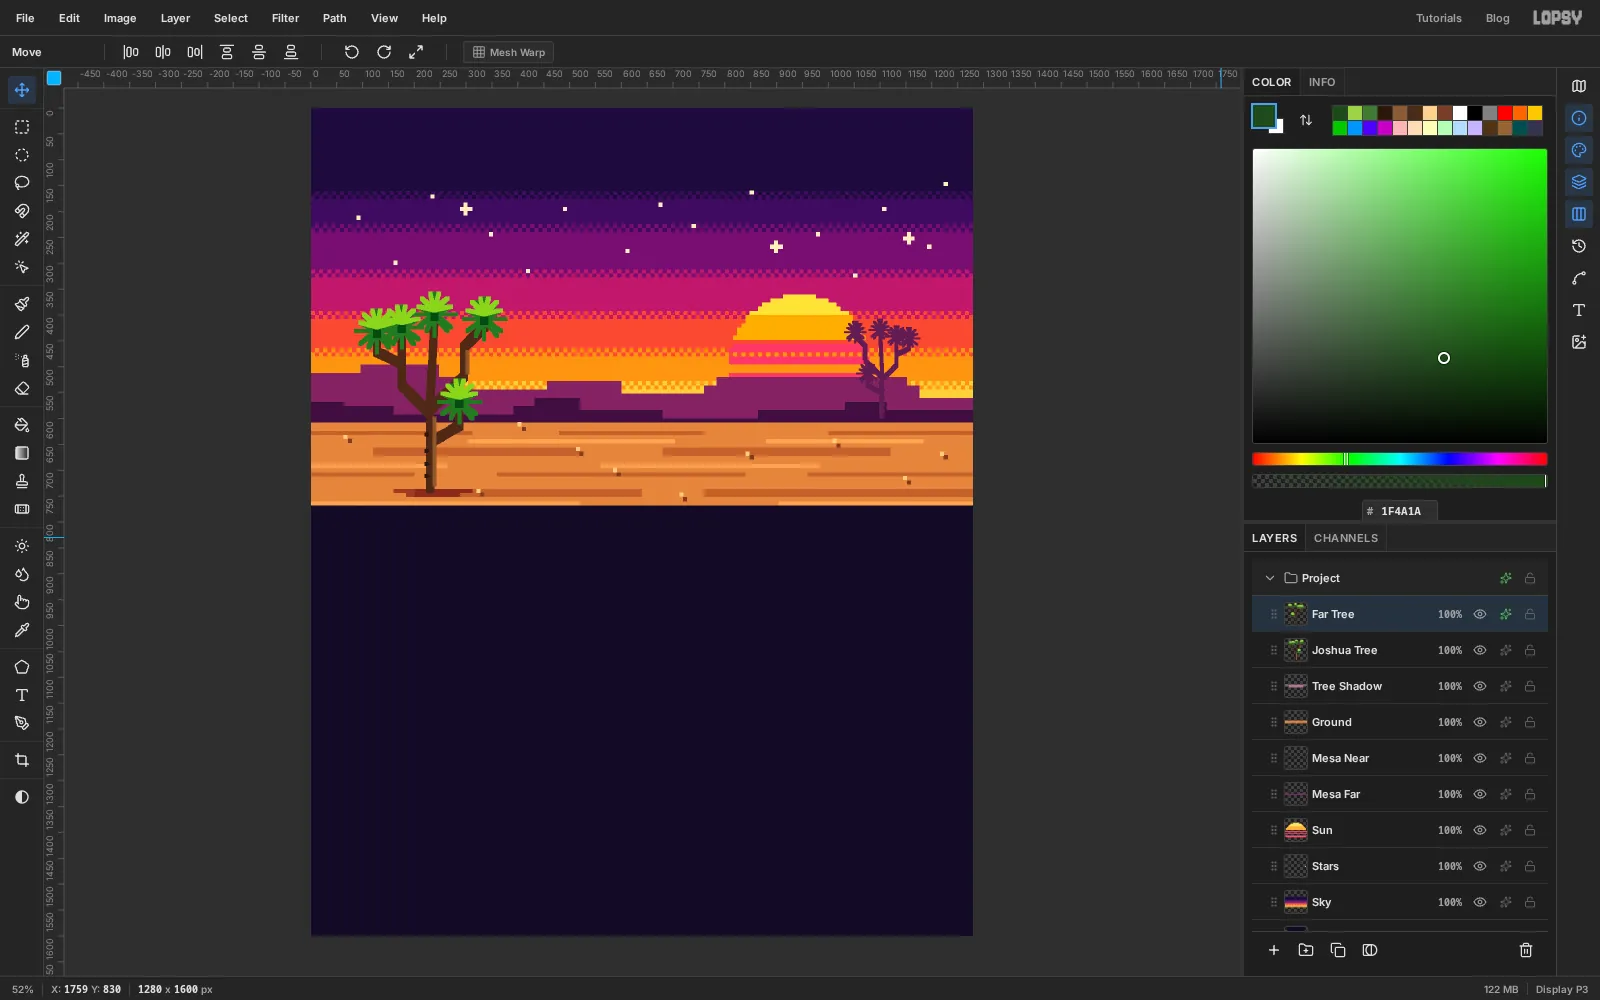
Drag the small tree with the Move tool until its base sits on the horizon, at about
1104, 600, partly in front of the sun.Open its effects drawer (the fx button on its row), turn on Color Overlay and set it to . The whole tree becomes one flat colour, just like the mesa behind it, which pushes it into the distance.
-
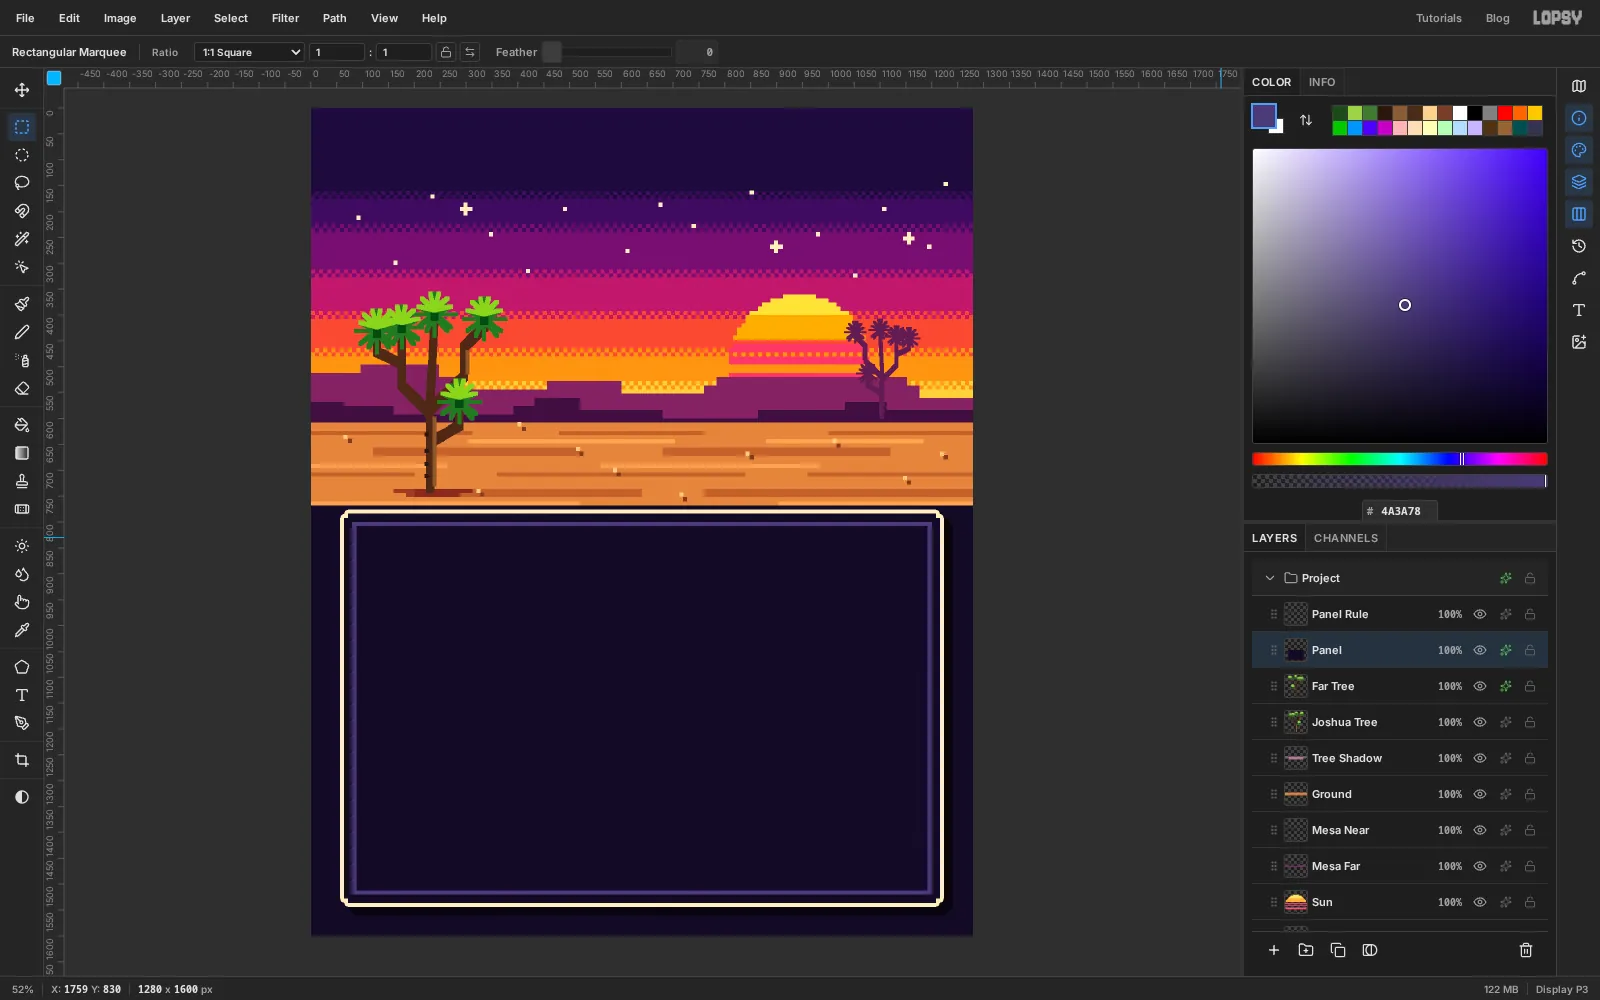
Build the game window
The charts live in a game window.
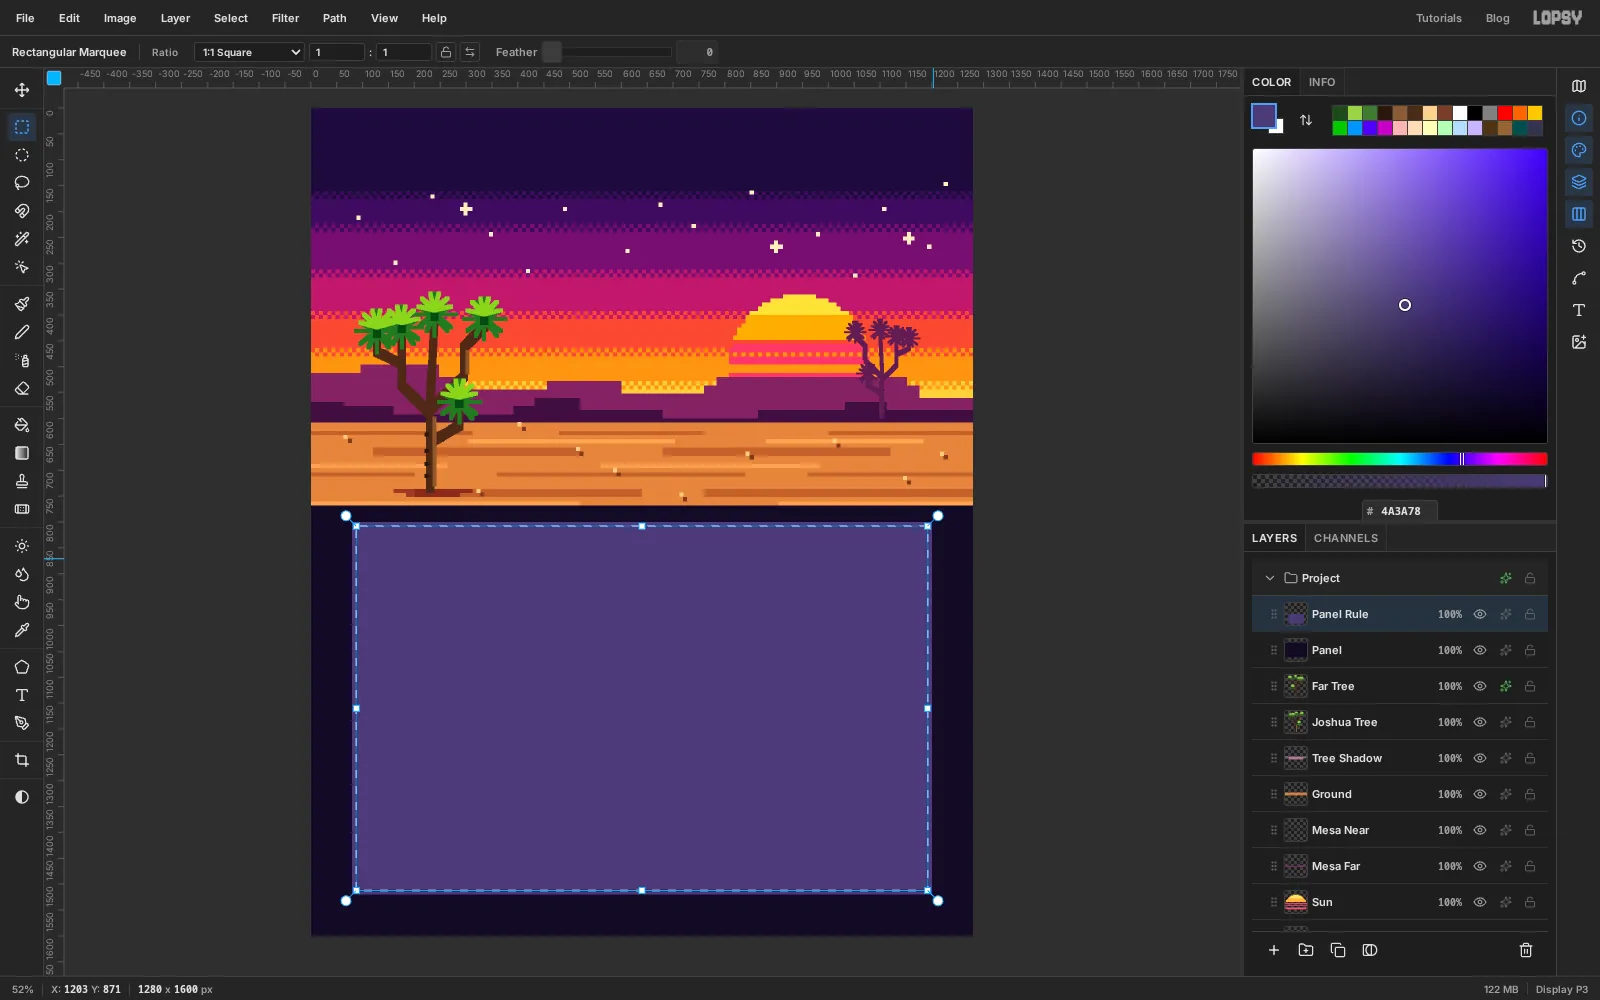
- Add a layer named
Panel. Select from64, 784to1216, 1536and fill it with . - Add a layer named
Panel Rule. Keep the selection, choose Select → Shrink… and shrink it by16. Fill with . - Shrink again by
8and press Delete. That leaves a ring one cell wide inside the window.
- Add a layer named
-
Notch the corners and add the border
Old game windows have cut corners. Click the
Panellayer and select the 8 × 8 cell in each of its four corners: drag the first one, then Shift-drag the other three. Press Delete and deselect.Open the panel's effects drawer:
- Stroke: width
8, colour cream . The stroke follows the notches, so the corners step in. - Drop Shadow: offsets
16and16, Blur0, Opacity60, black. Blur 0 gives the hard-edged shadow that pixel art needs.
- Stroke: width
-
Draw dashed gridlines
The temperature chart runs from
1064at 56°F upwards, at 4 px per degree. So 60°F is at y1048, 80°F at968and 100°F at888.- Add a layer named
Gridlines. In the top-left corner, fill a dash from0, 0to8, 4with . Select0, 0to16, 4(the dash plus a gap) and Define Pattern. Press Delete. - Drag a strip 4 px tall from x
152to1168, centred on y1048. Shift-add the same strip at968and at888. - Fill with Pattern, using the dash pattern, and deselect.
Finish the chart area with a solid divider: Pencil at size
8in the same colour, click at116, 1084and Shift-click at1164, 1084.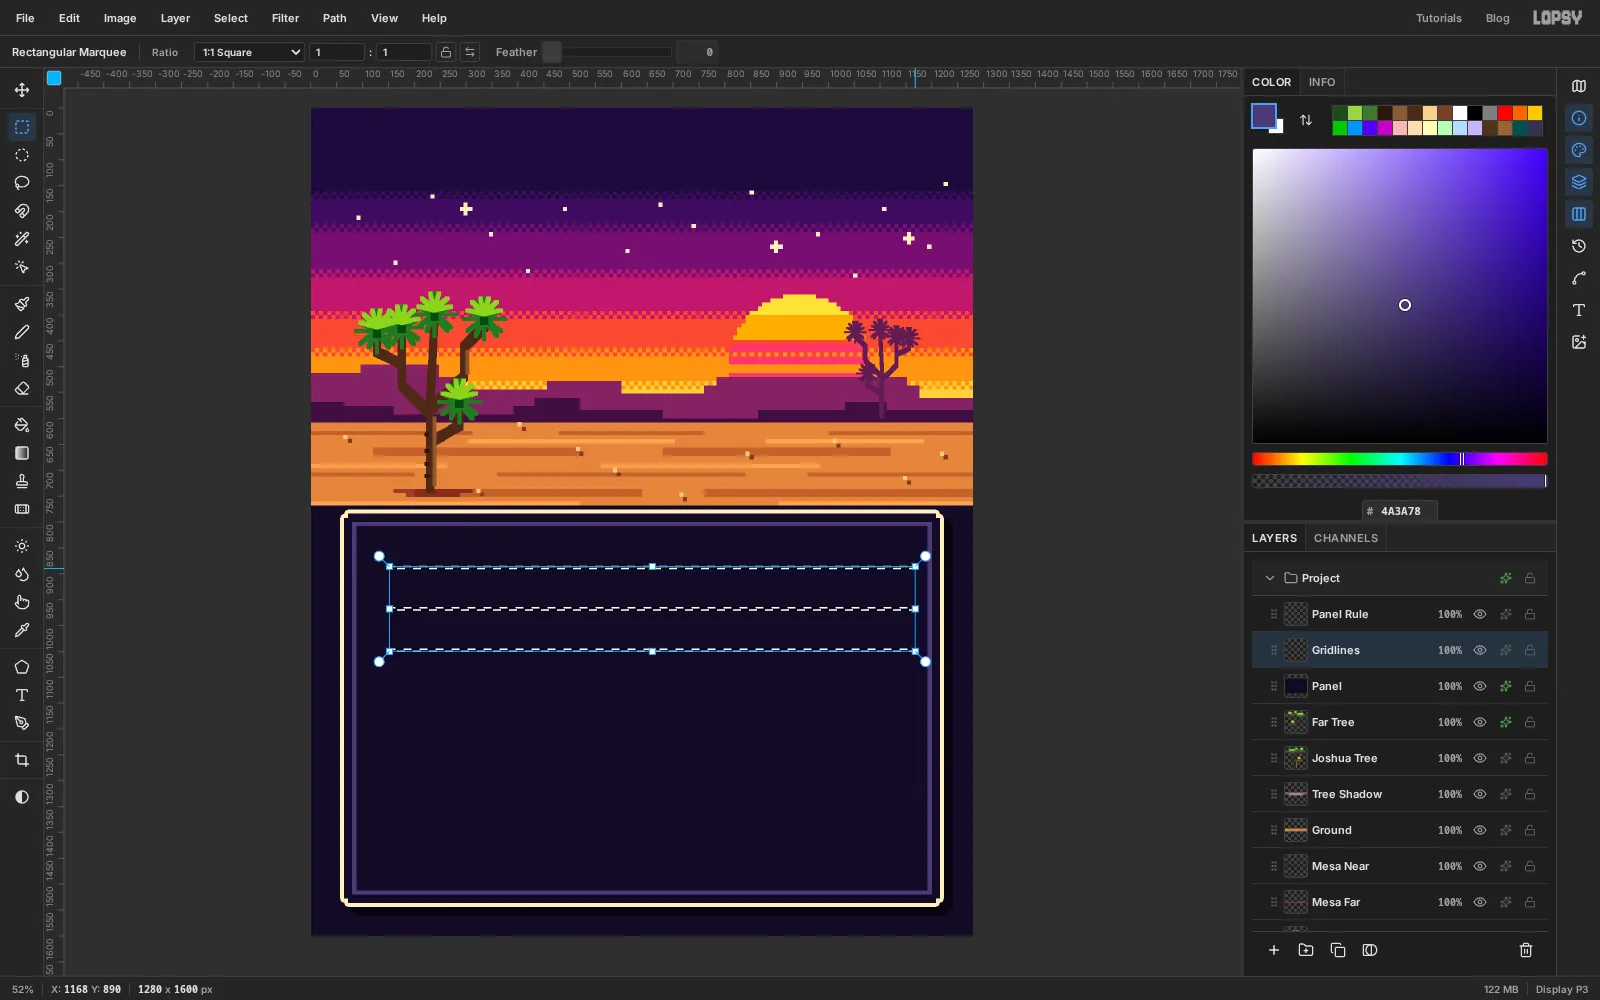
- Add a layer named
-
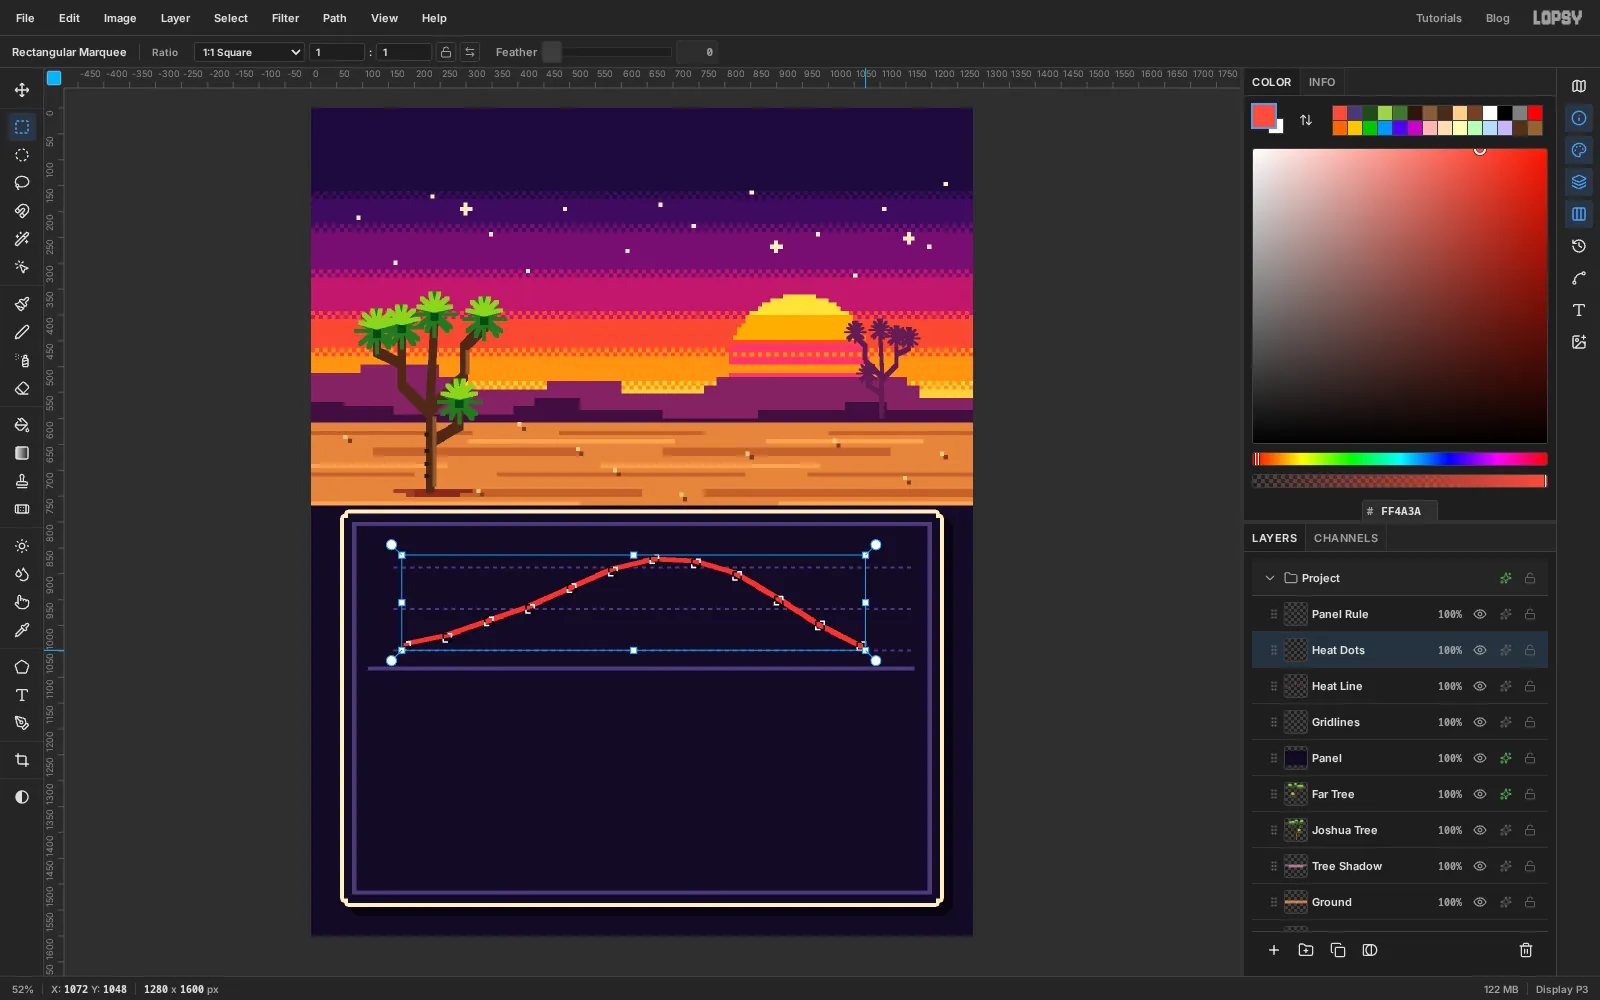
Plot the temperature line
The twelve months are columns 80 px apart. January's column runs from x
160to208, so its centre is184. Each later month is 80 px further right, ending with December at1064.The average highs, January to December, are 63, 67, 74, 81, 90, 99, 104, 103, 97, 85, 72 and 62°F. Each degree is 4 px, and 56°F sits on y
1064, so a point's y is1064 − (temperature − 56) × 4. So January is at184, 1036and July at664, 872.- Add a layer named
Heat Line. With the Pencil at size8in red , click January's point and Shift-click each month after it in turn. - Add a layer named
Heat Dots. Drag a 16 × 16 marquee centred on January's point. Shift-add one on each of the other eleven.
- Add a layer named
-
Turn the points into coins
Fill the twelve squares with gold and deselect.
Give both
Heat LineandHeat Dotsa Drop Shadow with offsets8and8, Blur0and Opacity80, in black. Now the line seems to float above the gridlines like a sprite.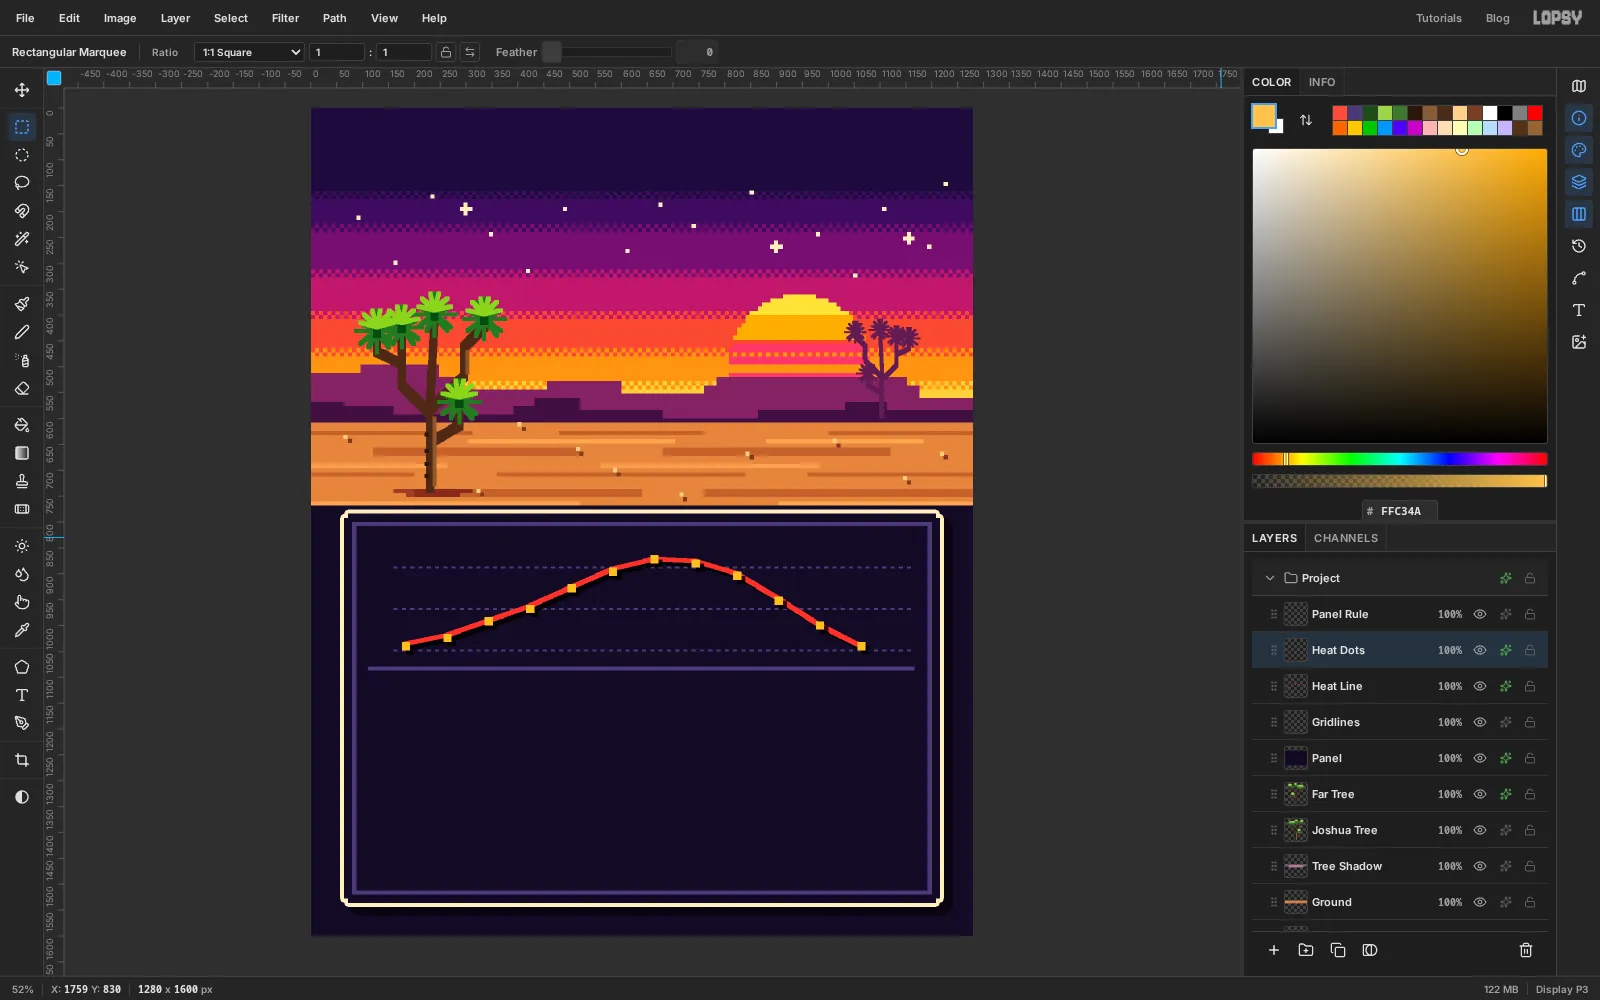
-
Make a water-block tile
Each rain block stands for 0.05 inches. You'll draw one, then stack it with a pattern.
Click
Heat Dotsand add a layer namedRain Blocks. In the top-left corner, build one block:- Fill
0, 8to48, 24with blue . - Fill the top half-cell (
0, 8to48, 12) and the left edge (0, 8to8, 24) with light blue . - Fill the bottom half-cell (
8, 20to48, 24) and the right edge (40, 12to48, 24) with .
Now select
0, 0to80, 24. That's the block plus the gaps on its right and above it. Define Pattern, press Delete and deselect.The tile is 80 px wide, the same as the column spacing, and 24 px tall, one block plus a gap.
- Fill
-
Mark out the rain columns
The rainfall, January to December, in inches: 0.50, 0.56, 0.35, 0.12, 0.05, 0.00, 0.40, 0.65, 0.34, 0.15, 0.19 and 0.56. Divide each by 0.05 and round to get the number of blocks: 10, 11, 7, 2, 1, 0, 8, 13, 7, 3, 4 and 11.
Every column stands on y
1440, and each block adds 24 px. So January's column is 10 × 24 = 240 px tall: drag from160, 1200down to208, 1440. Hold Shift for each of the others, 80 px further right each time. Skip June.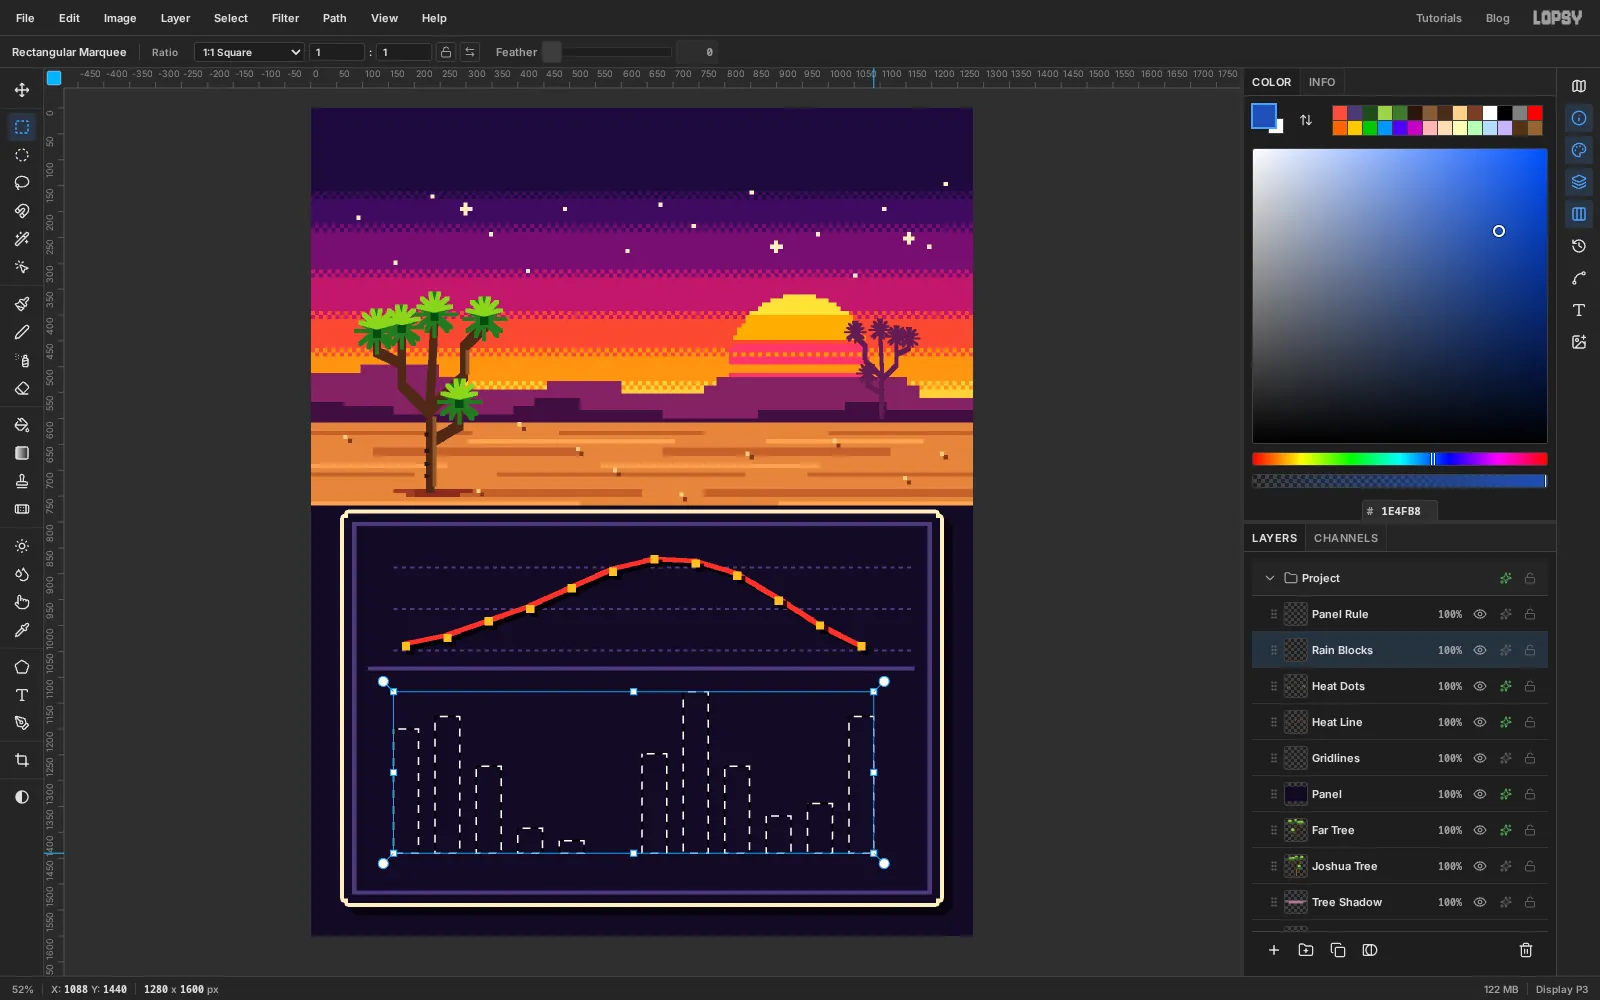
-
Fill the columns with blocks
Choose Edit → Fill with Pattern… and apply the water-block pattern. Because the tile is exactly as wide as the column spacing and as tall as one block, and the baseline is a multiple of 24, every column fills with whole blocks.
Deselect and give
Rain Blocksthe same hard Drop Shadow as the line:8,8, blur0, opacity80.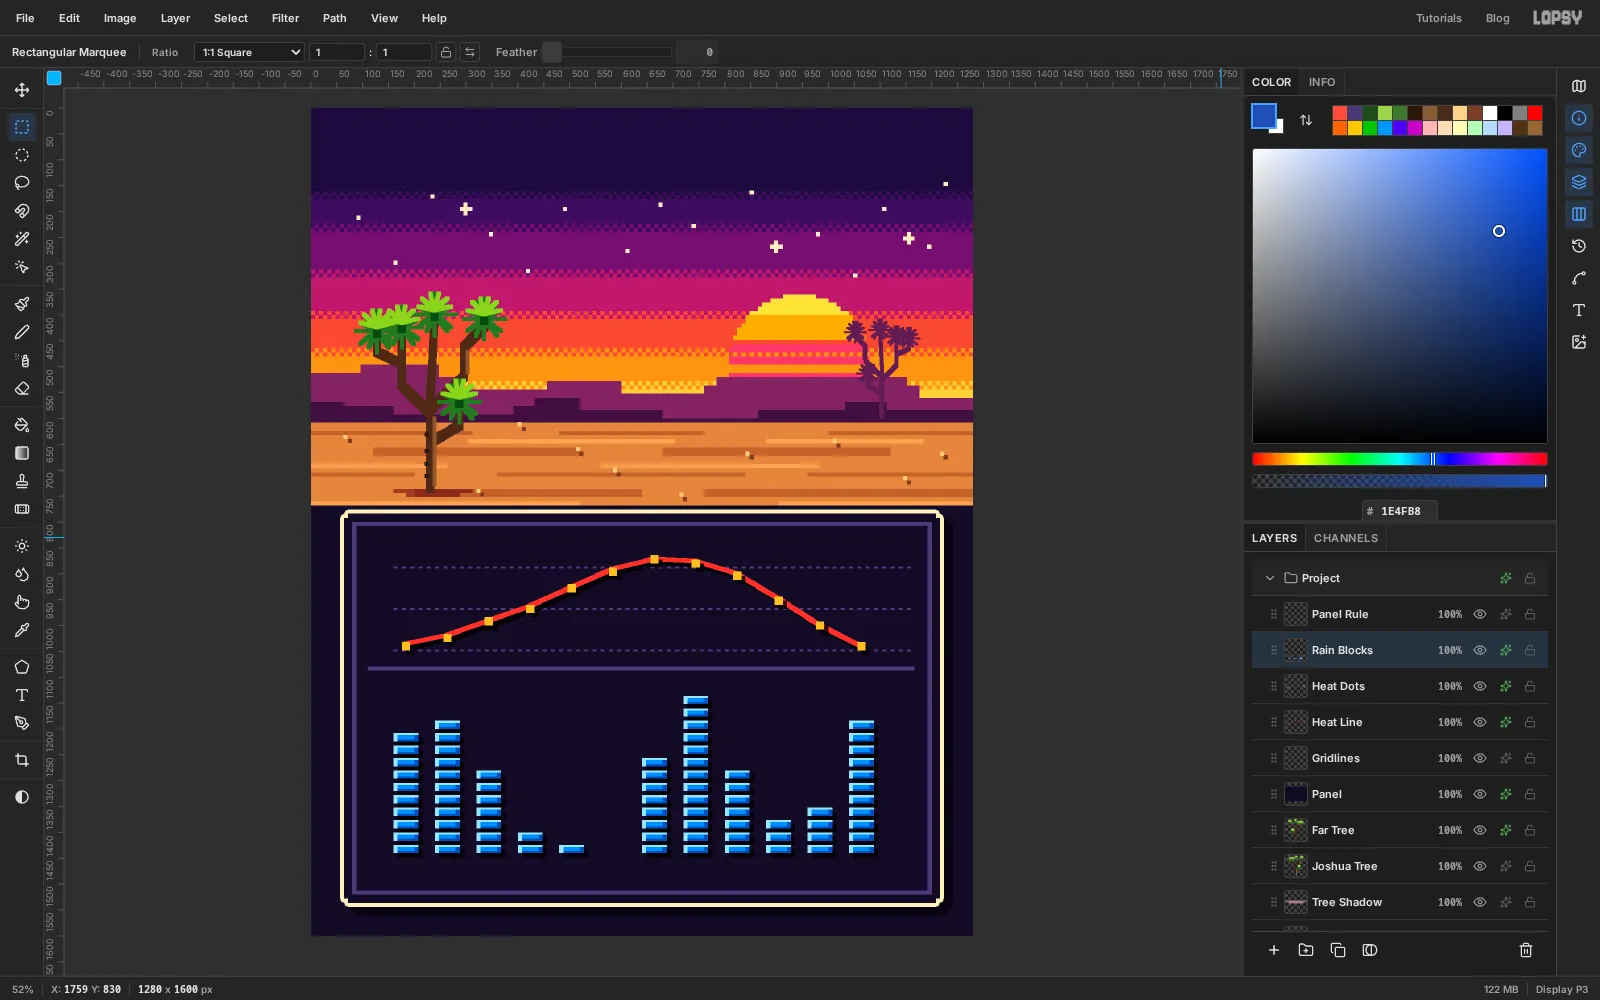
-
Mark June's zero
June had no rain at all. A missing bar can look like missing data, so mark it on purpose.
Add a layer named
June Slot. With the Pencil at size4in , draw a small rectangle the size of one block in June's slot, just above the baseline: click one corner, then Shift-click the other three corners and back to the start.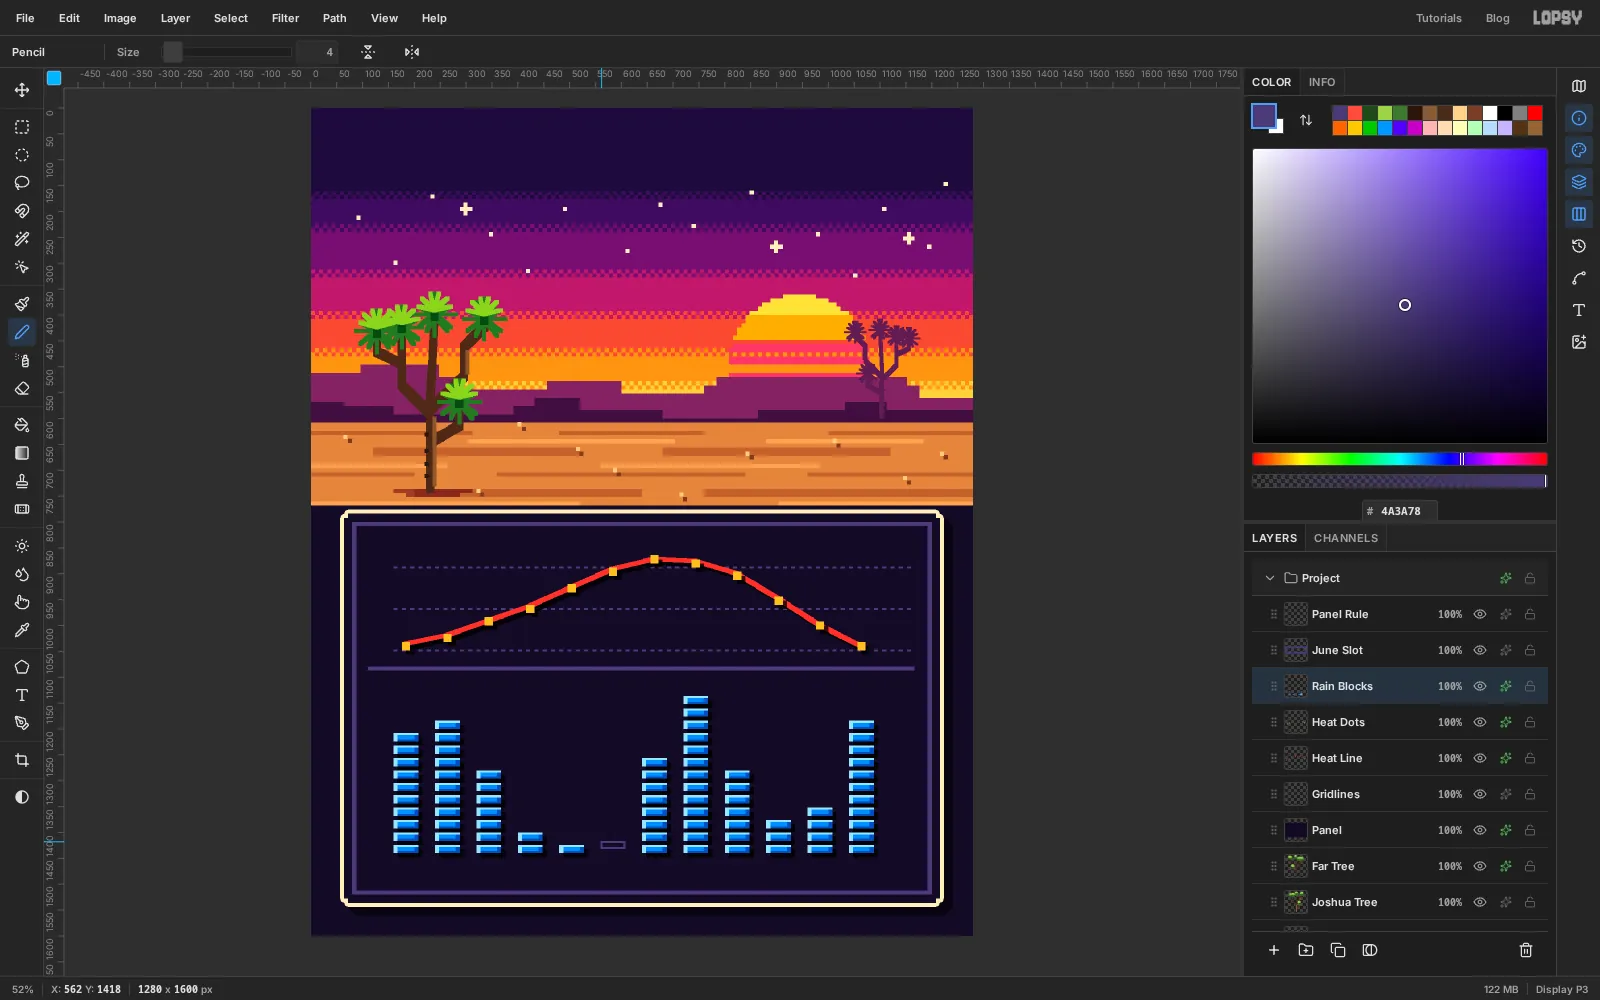
-
Set the title
Click a non-text layer such as
Far Treefirst, so the Text tool starts a new text instead of editing an old one.New text layers are named after what you type. Rename them as you go if you like; the steps below use short names such as
Title,MonthsandLegend.- Pick the Text tool (T), font Jersey 25, size
168, cream . Click anywhere in the empty sky and typeXERIC YUCCAS. Press Tab to finish. - With the Move tool, centre it across the canvas in the top band, about
96px down. Arrow keys nudge it one pixel at a time. - Give it a Drop Shadow in magenta with offsets
8and8, blur0, opacity100. - Click
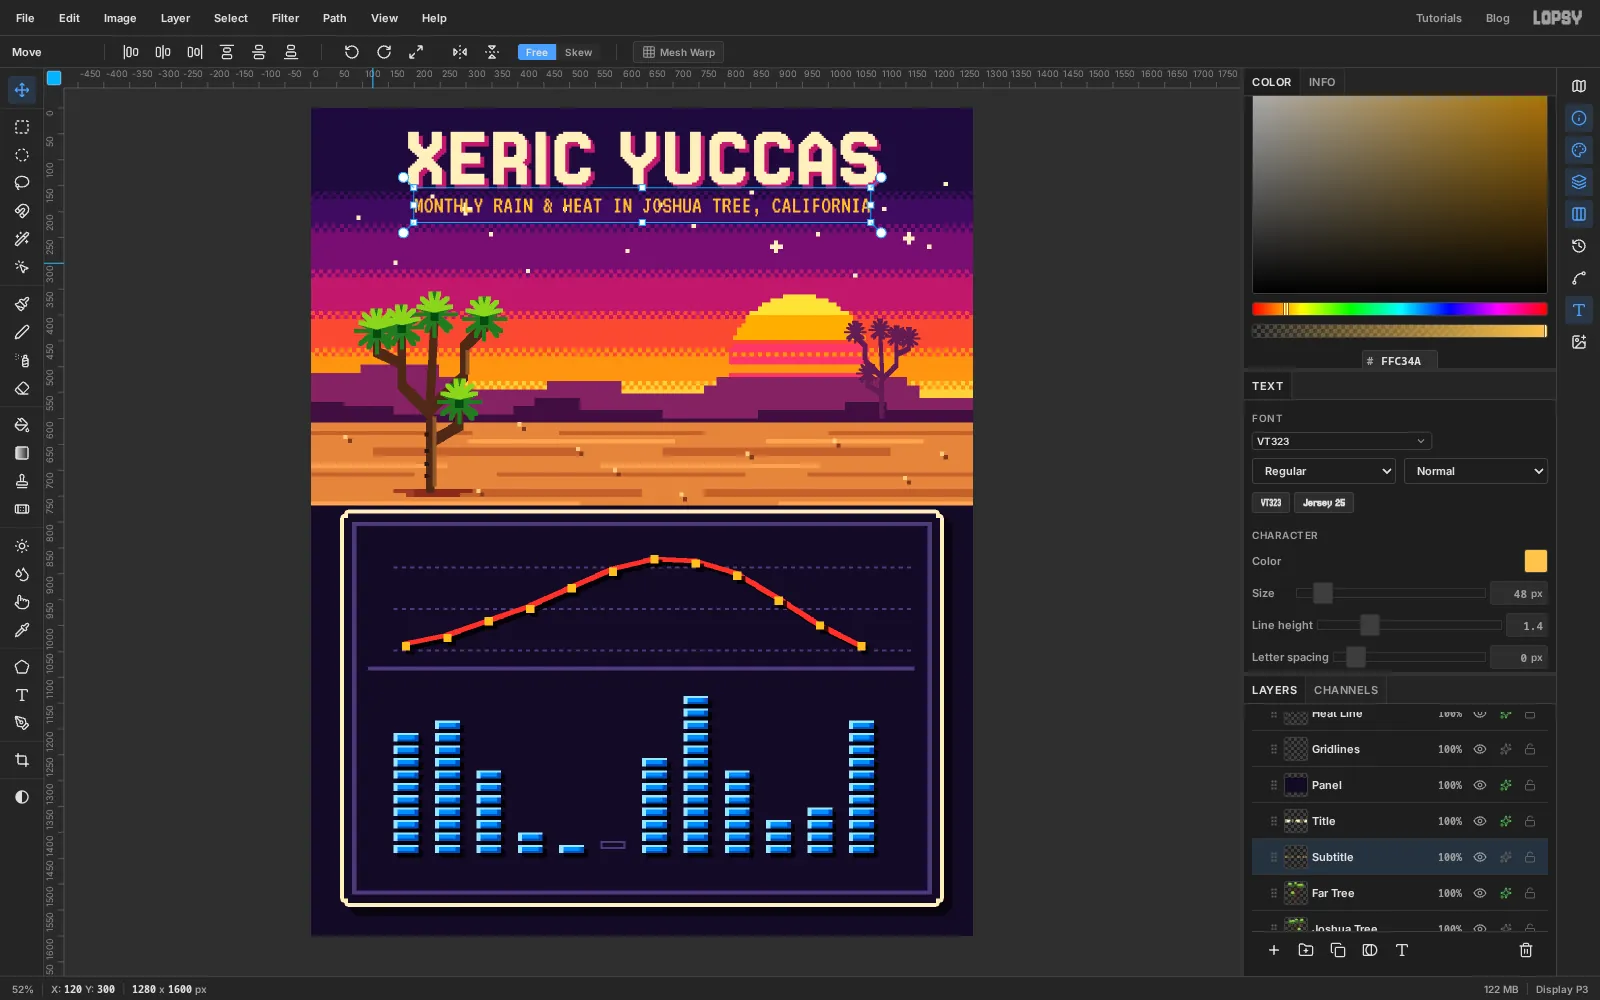
Far Treeagain. Set VT323, size48, yellow , and typeMONTHLY RAIN & HEAT IN JOSHUA TREE, CALIFORNIA. Centre it under the title, about192px down.
- Pick the Text tool (T), font Jersey 25, size
-
Tidy the stars around the title
A few stars now crowd the subtitle. Click the
Starslayer.- Pick the Eraser (E), set the size to
24, and click each single star above about y220. - Press M for the Rectangular Marquee, drag a small marquee around the twinkle at about
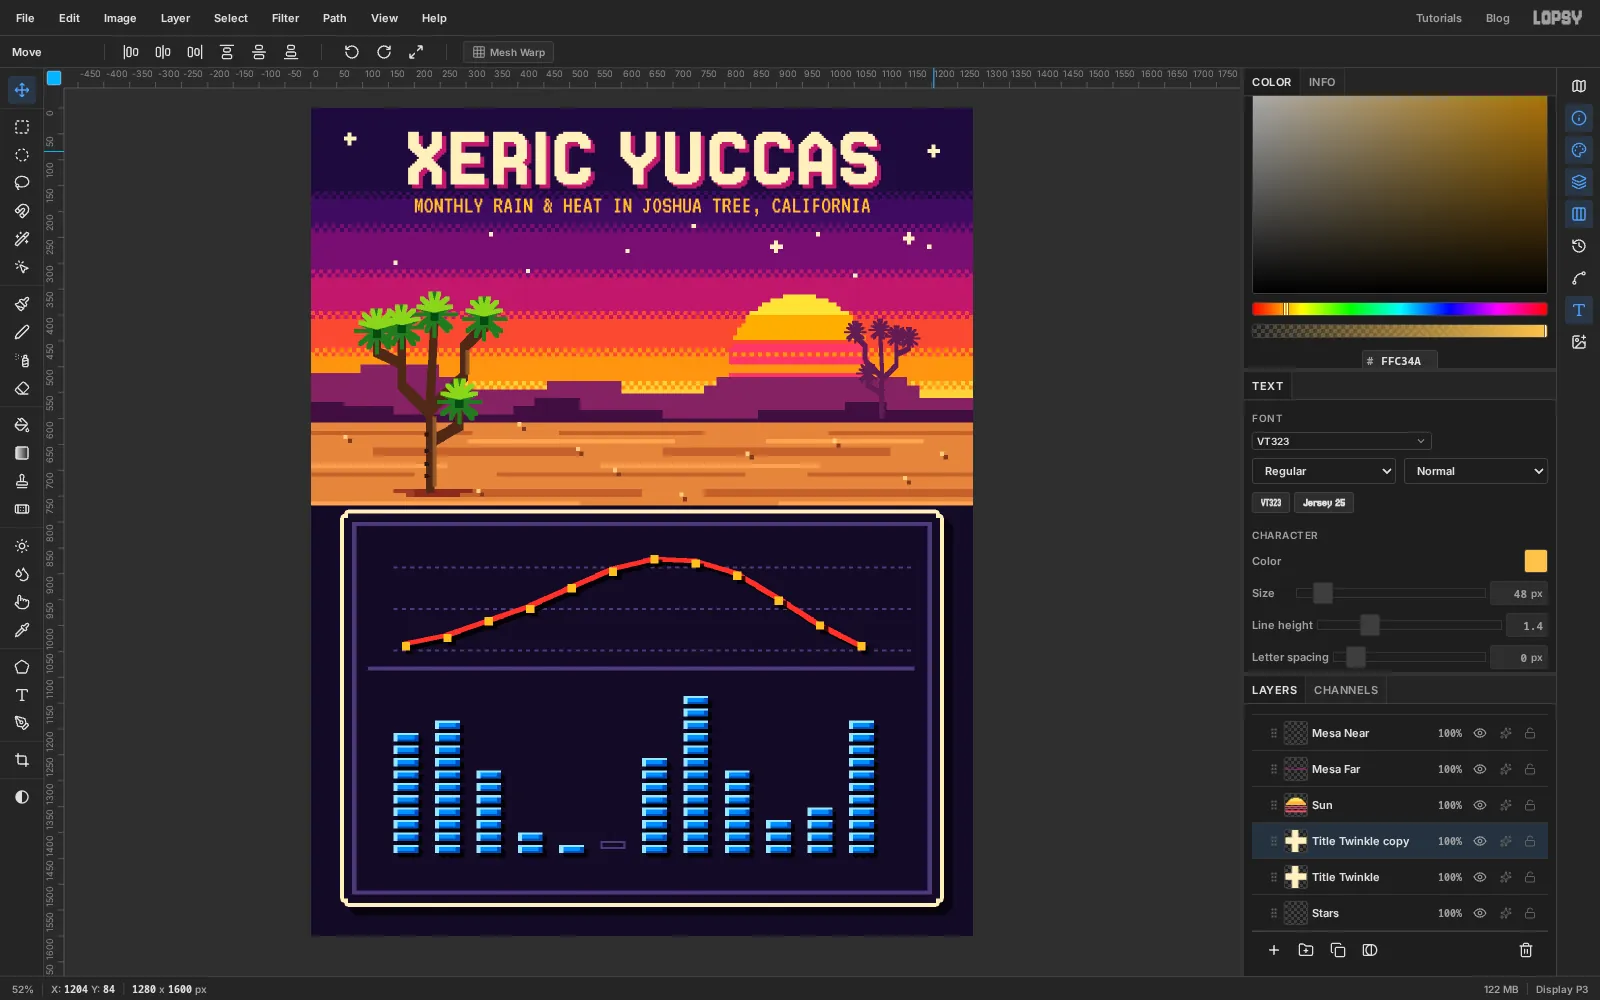
300, 196, and press Cmd+X to cut it, then Cmd+V. The paste lands in place as a new layer. Rename itTitle Twinkle, deselect, and drag it to the left of the title. - Duplicate Layer and drag the copy to the right of the title, a little lower, so the two don't look mirrored.
- Pick the Eraser (E), set the size to
-
Add the HUD line and the ticks
Game screens show the score along the top. Here the HUD names the two charts. Before each new text, click
Rain Blocksso the Text tool starts a fresh layer instead of editing the last one.- Tiny5, size
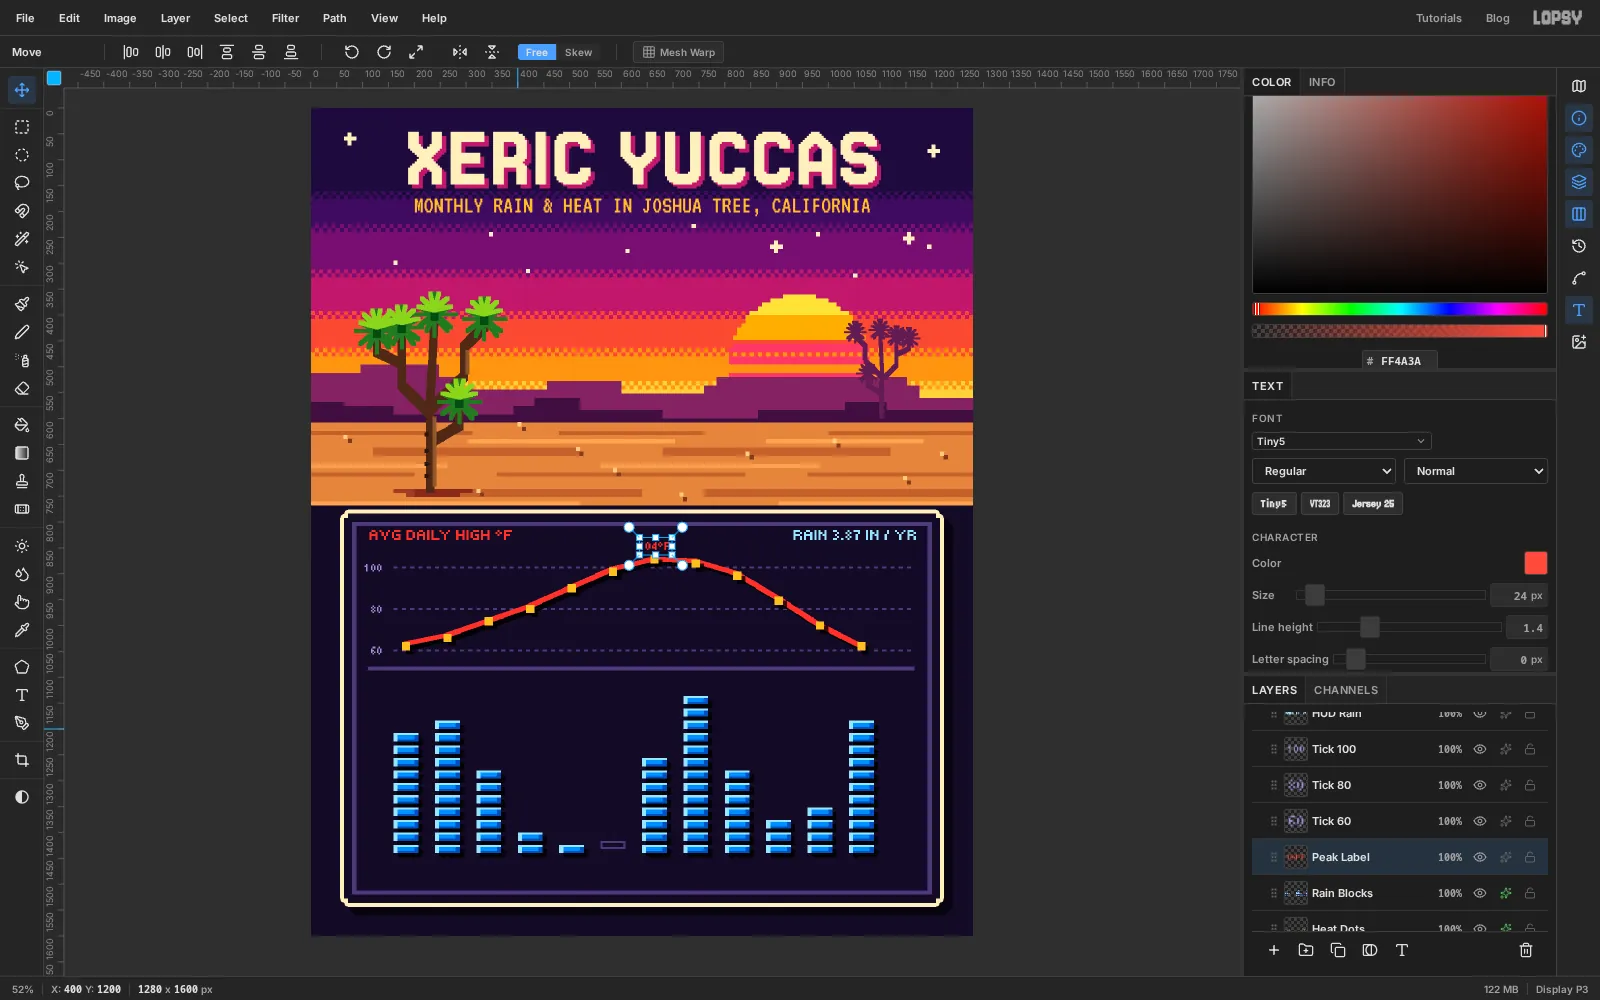
32, red : typeAVG DAILY HIGH °F. Move it so its left edge sits at x112, centred on y824. - Same size, light blue : type
RAIN 3.87 IN / YRand line its right edge up with x1168. 3.87 is the yearly total. - Tiny5, size
24, lavender : type100,80and60as three texts. Line their right edges up at x136, each centred on its gridline. - Size
24again, in red: type104°Fand centre it just above the July coin. Labelling the peak directly saves the reader from tracing it back to the axis.
- Tiny5, size
-
Label every column
With Tiny5 at size
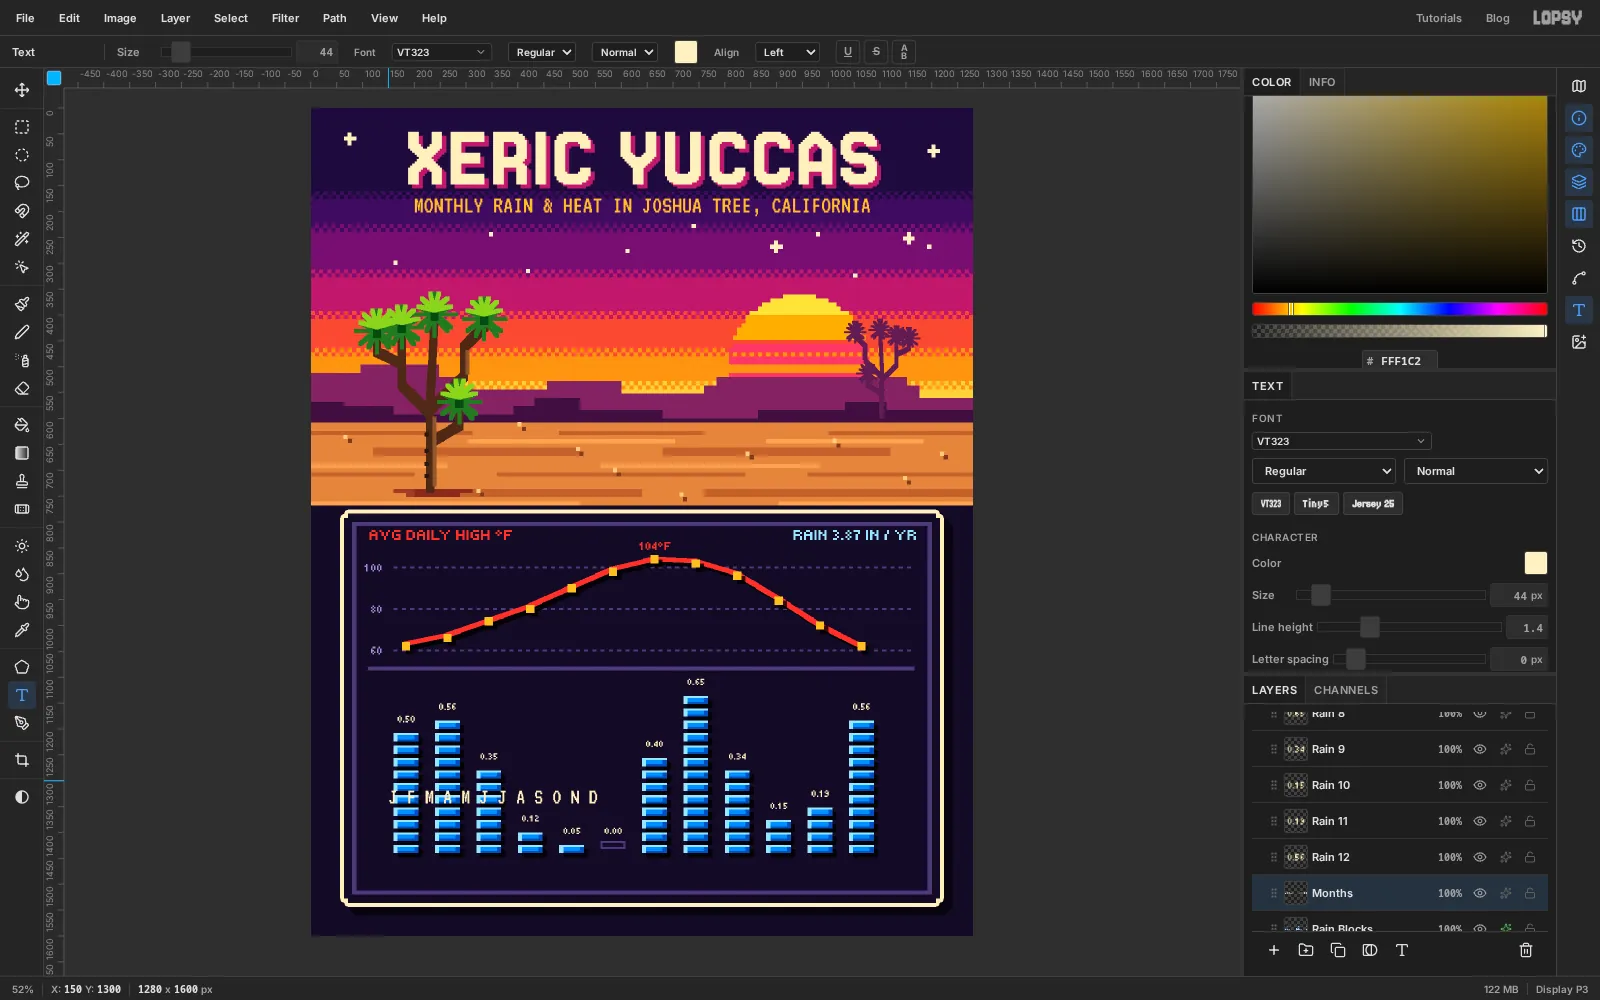
20in cream, type each month's rainfall as its own text:0.50,0.56and so on. Centre each one on its column, about 20 px above the top block. June's0.00goes above the empty slot.The labels make the exact values readable. The blocks still show the shape at a glance.
-
Space the month initials to the columns
Type all twelve initials as one line: VT323, size
44, cream,J F M A M J J A S O N Dwith a space between each pair.VT323 is monospaced, so every character, space included, is the same width. Each initial plus its space has to span exactly one 80 px column, so each character needs to be 40 px wide. At this size a VT323 character is about 17.5 px wide, so open the Text panel and set Letter spacing to
22.5. Move the line so it's centred under the columns, just below the baseline.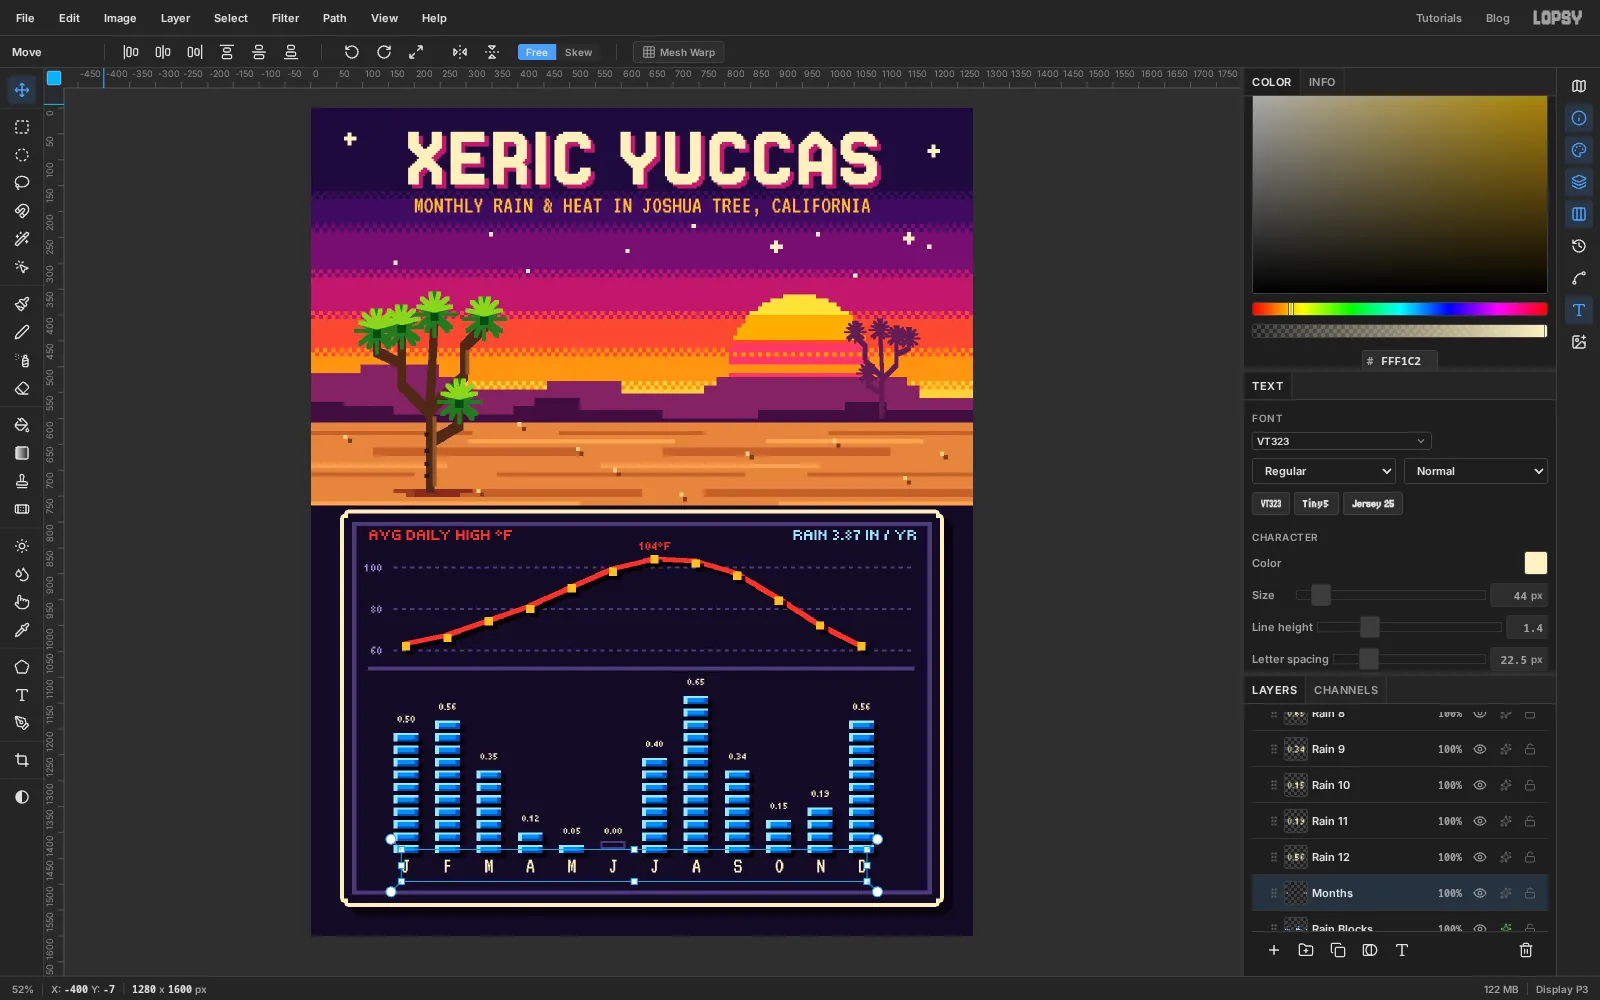
-
Add a legend
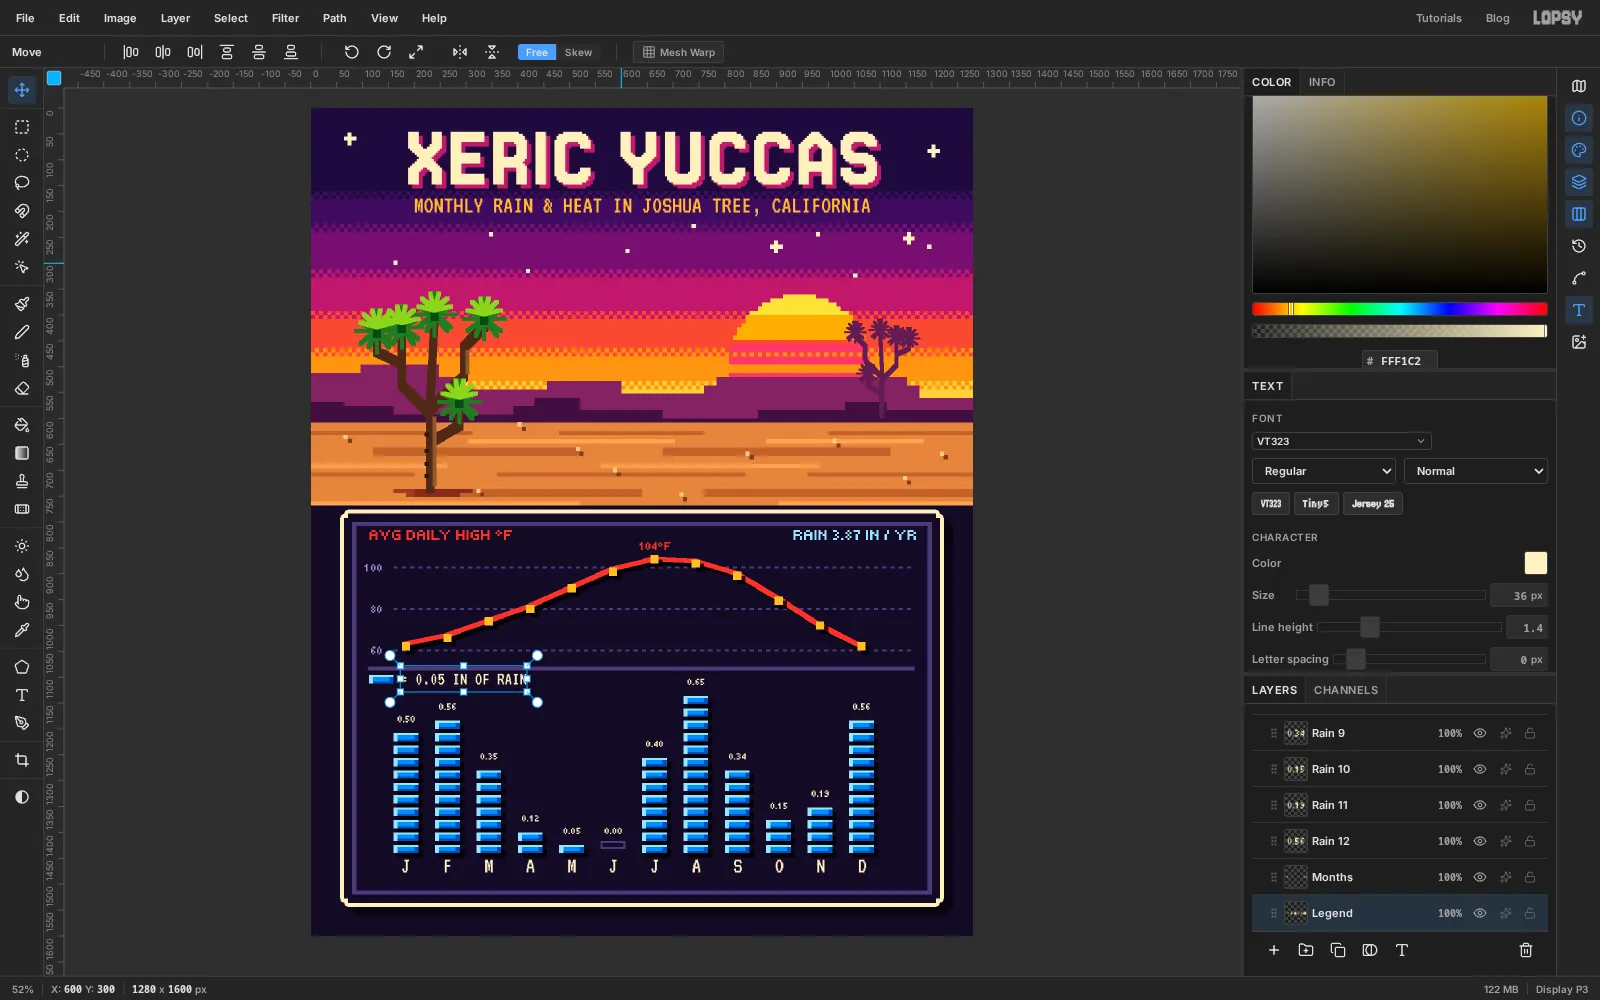
The reader needs to know what one block means. Take one straight out of the chart:
- Click
Rain Blocksand drag a marquee around January's bottom block (160, 1416to208, 1440). - Press Cmd+C, then Cmd+V. The block pastes in place as a new layer. Rename it
Legend Blockand deselect. - With the Move tool, drag it to the left margin, just under the divider (
112, 1096). - VT323, size
36, cream: type= 0.05 IN OF RAINand line it up just right of the block, centred on it.
- Click
-
Rotate an axis title
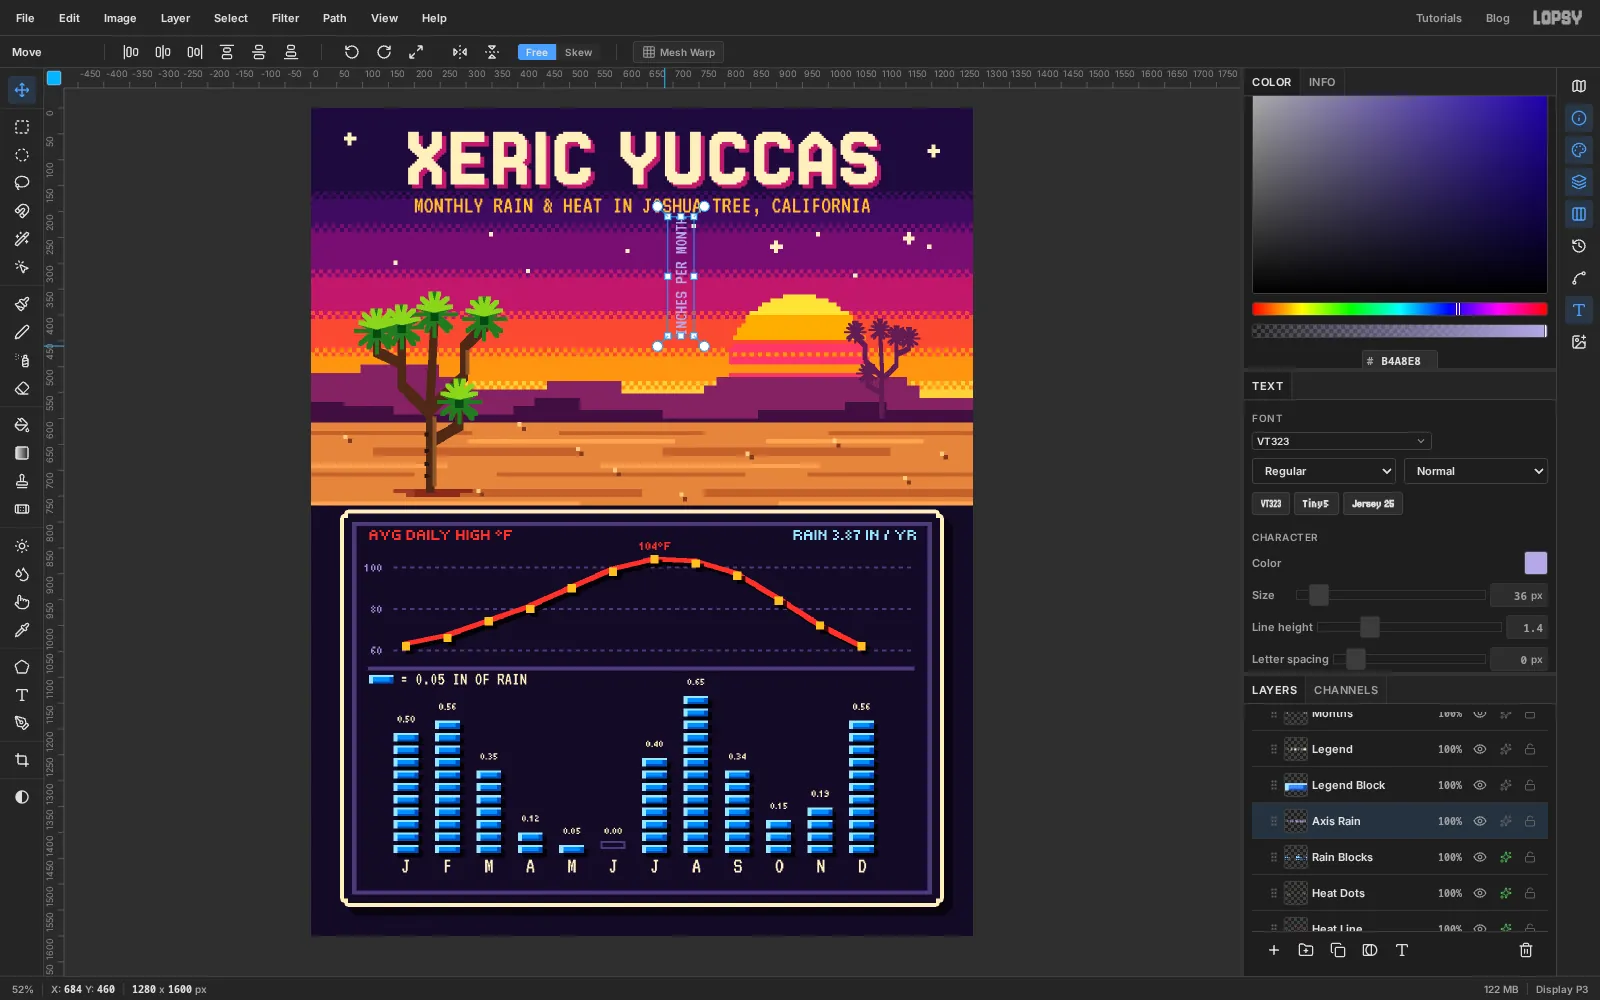
- VT323, size
36, light lavender : typeINCHES PER MONTHanywhere in open space. - With the Move tool, grab the round handle just outside the text's top-left corner. Hold Cmd to snap to 15° steps and drag counter-clockwise until the text stands upright, reading bottom to top. Release and press Enter.
- Move it into the left margin of the rain chart, centred at about
116, 1300.
- VT323, size
-
Credit the data
Click
Paneland type the source in VT323, size30, lavender:DATA: NOAA 1991-2020 CLIMATE NORMALS, TWENTYNINE PALMS, CA (JOSHUA TREE NP). Centre it in the strip under the window, at about y1570.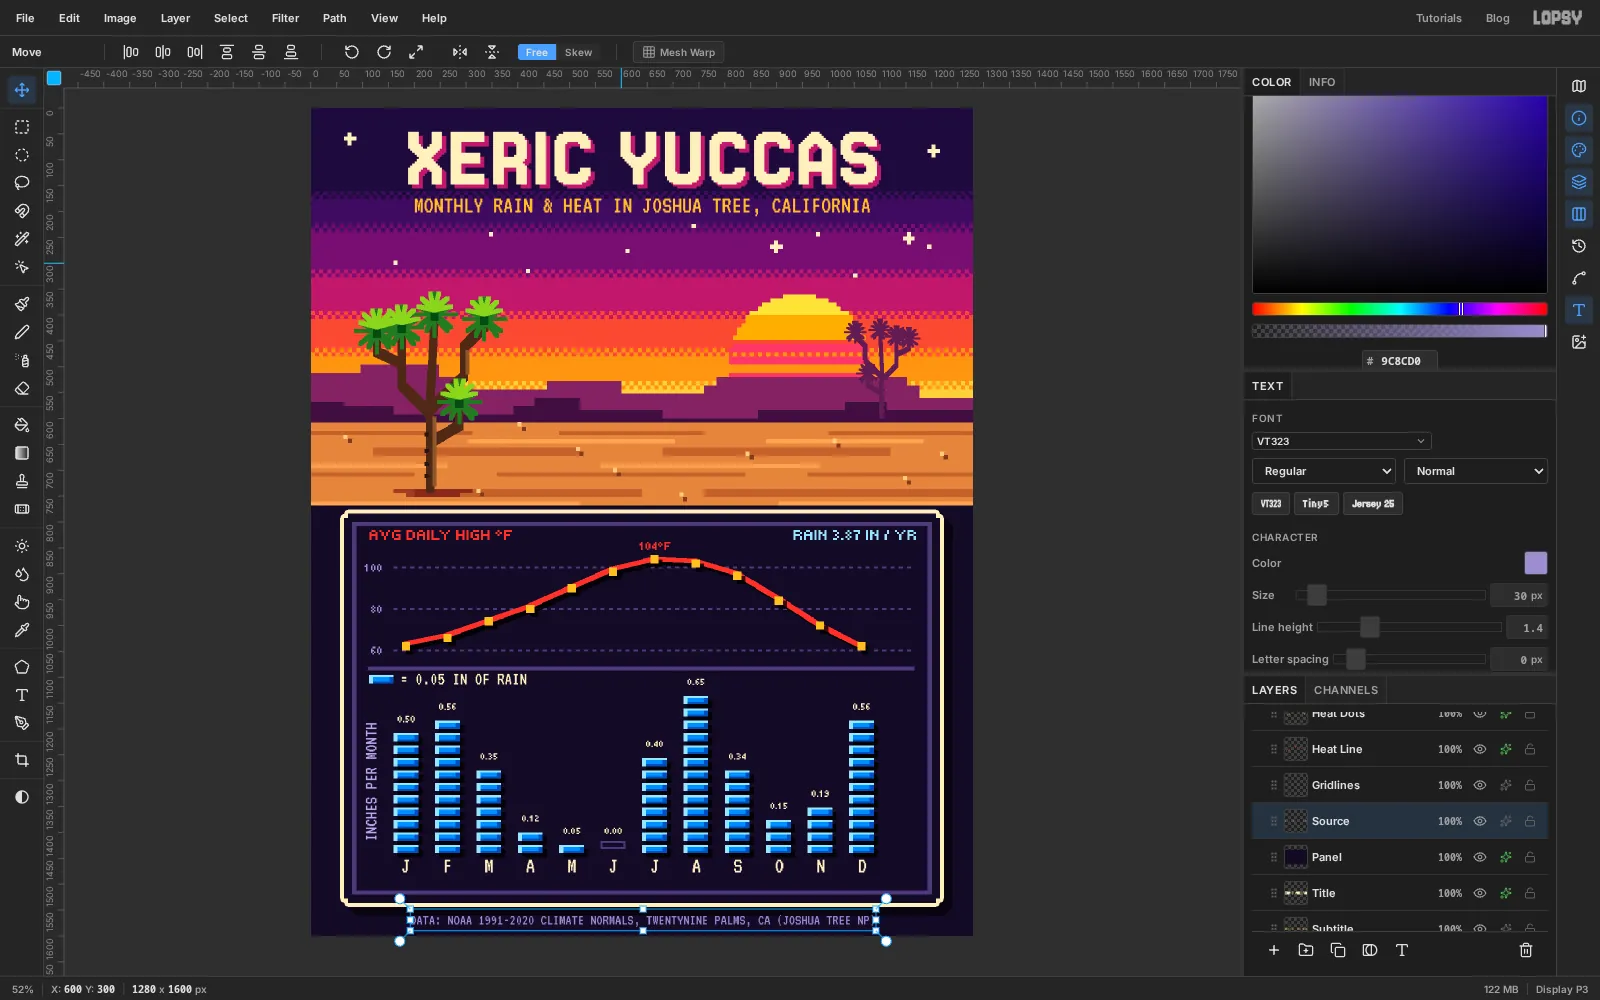
-
Group the trees and nudge them as one
Click
Tree Shadow, Shift-clickFar Treeto select it with everything in between, and choose Layer → Group Layers. Rename the groupTrees.Check the balance. The big tree sits a little too close to the centre, so with the
Treesgroup selected, take the Move tool and drag it a few cells left. With Snap on, the group lands on the grid. Everything inside moves together, shadow included.Before you drag, turn the grid back on with View → Show Grid, so Snap works again. When the trees sit where you want them, hide the grid and you're done. Save the project with File → Save Project, and export it with File → Quick Export PNG.