Make an 8-Bit Pixel Art Data Visualization Poster
Chart 47 years of the Antarctic ozone hole as an 8-bit game screen in Lopsy, with an 8 px grid, dithering, pixel sprites and pixel fonts.
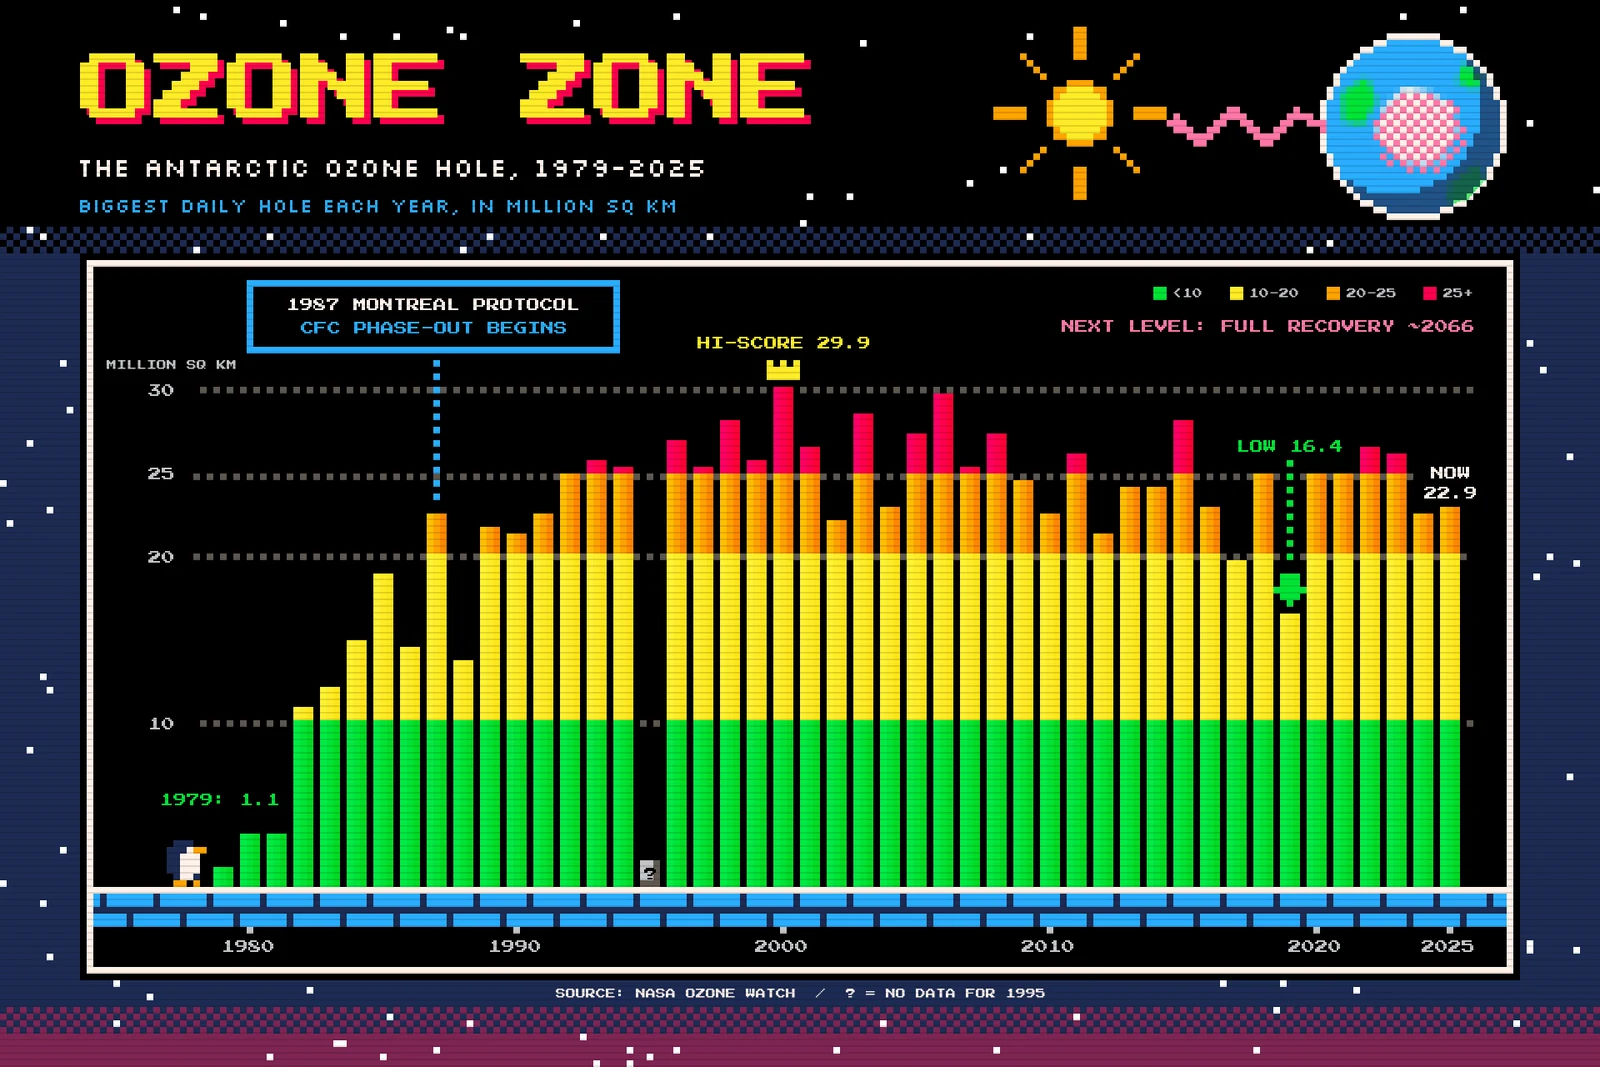
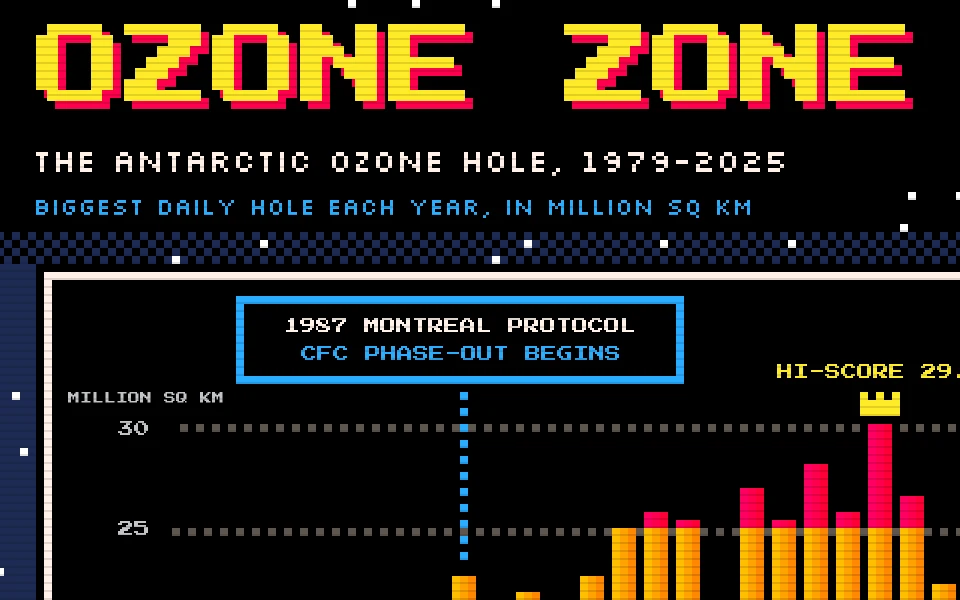
The Antarctic ozone hole grew fast through the 1980s. The world banned the chemicals that caused it in 1987, but the hole kept growing for another thirteen years before it levelled off. Recovery is now expected around 2066. That's a long game, so this tutorial charts it like one: a level from an old console, with a "hi-score", a power-up box and a penguin at the start line.
The data is real. It's the largest daily ozone hole of each year from NASA Ozone Watch, 1979 to 2025. There's no measurement for 1995, and the poster says so instead of hiding the gap.
Everything sits on an 8 px grid. One grid cell is one "pixel" of the 8-bit picture, so every bar, sprite and border lines up with the same lattice. That one rule does most of the work. (The type is the one exception: pixel fonts have their own grid, so the letters are close to the lattice but not locked to it.)
Along the way you'll use:
- View → Show Grid at 8 px with Snap, so marquees land on whole cells
- Define Pattern and Fill with Pattern for dithering, bevels and ice bricks
- Add Noise, Threshold and Pixelate to make a starfield
- marquees that add (Shift) and intersect (Shift+Alt), and Cmd-clicking a thumbnail to load a layer as a selection
- a "stencil" trick with Pixelate, Threshold and the Magic Wand that turns any shape into a stepped pixel shape
- Copy, Paste and the Move tool's rotate handle, then Merge Down
- the Drop Shadow and Color Overlay effects and the Multiply blend mode
- live text in Press Start 2P and Silkscreen
- groups, arrow-key nudges, and undo and redo to check your work
The palette comes from the PICO-8 fantasy console. Its colours are bright, flat and few:
-
Night
-
navy
-
plum
-
slate
-
Snow
-
silver
-
lavender
-
Green
-
yellow
-
orange
-
red
the four data bands
-
Sky blue
-
pink
-
brick
-
Set up a pixel grid
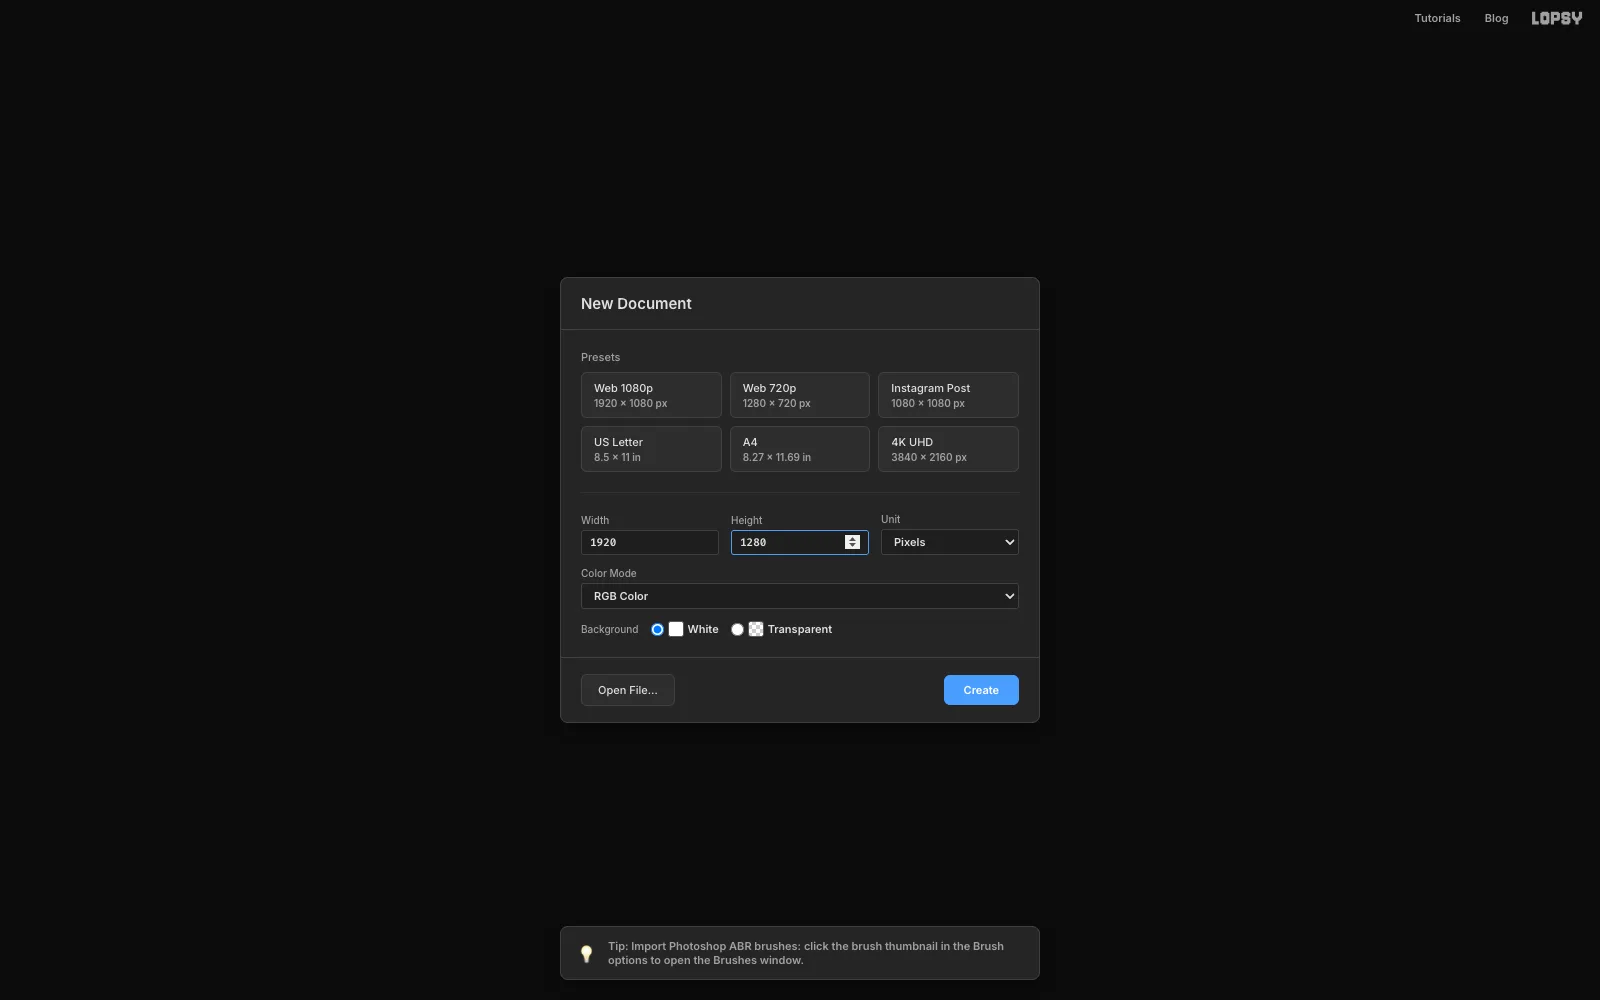
Open Lopsy. In the New Document dialog, set Width to
1920and Height to1280and click Create.- Choose View → Show Grid. A Grid slider appears at the right end of the options bar. Drag it down to
8px. - Make sure the Snap checkbox next to it is ticked.
From now on the grid is your pixel. A bar that's "3 cells wide" is 24 px.
- Choose View → Show Grid. A Grid slider appears at the right end of the options bar. Drag it down to
-
Paint the night sky
Select Background and rename it
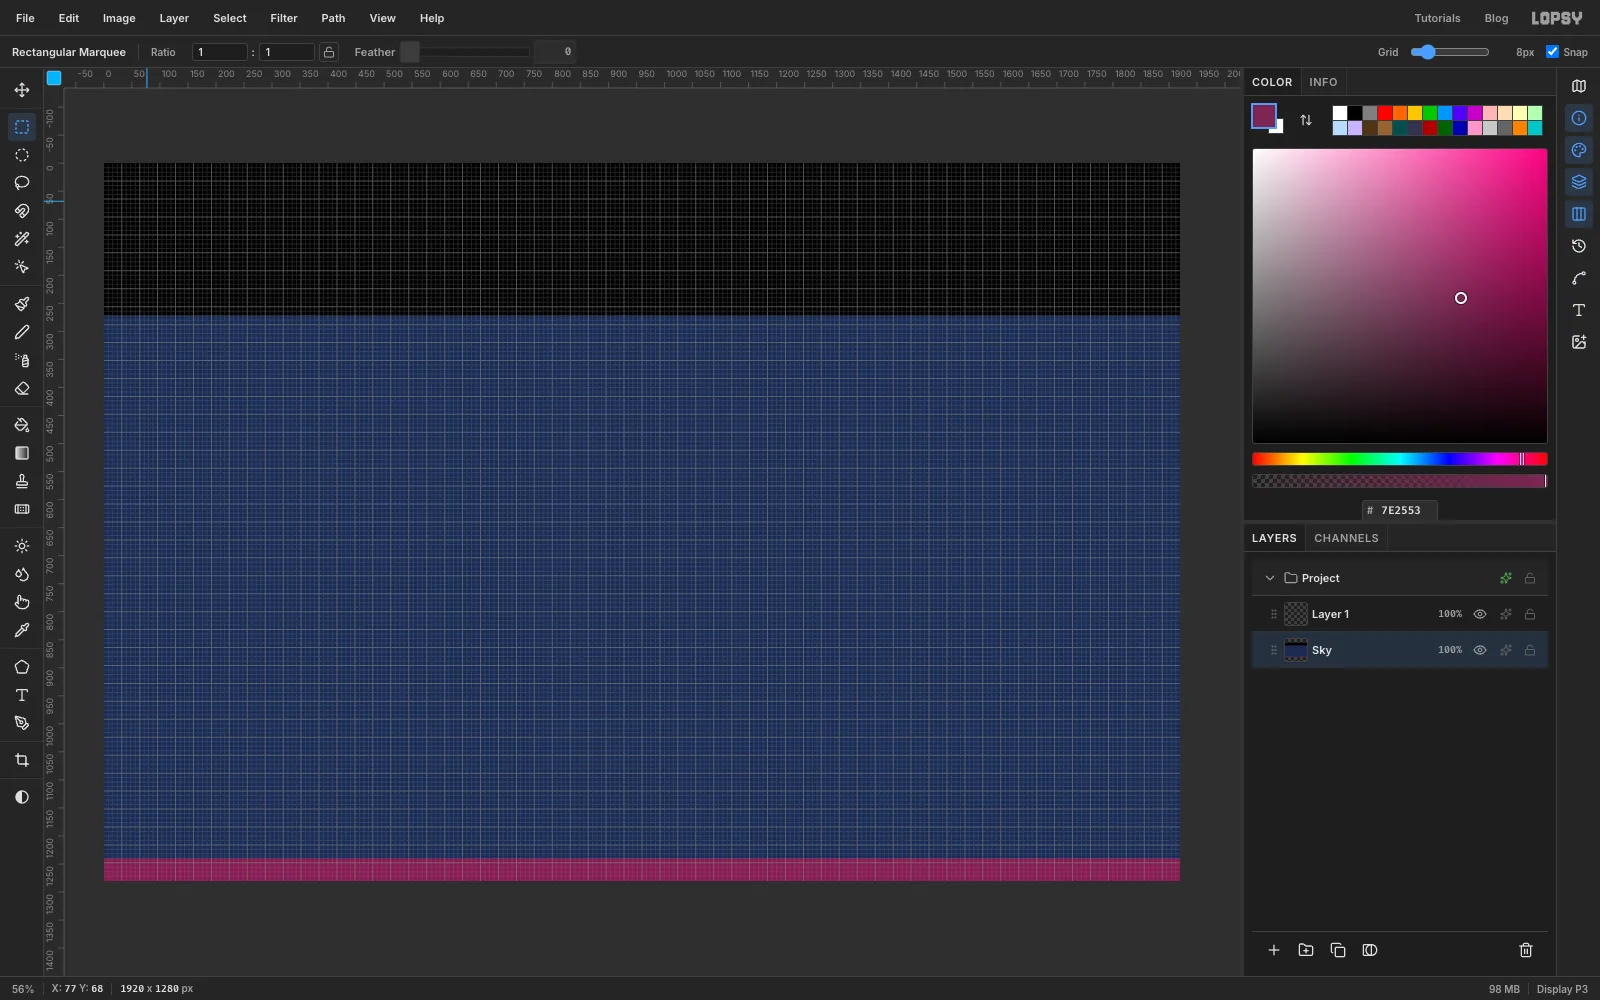
Sky(double-click its name in the Layers panel).- Set the foreground colour to navy and choose Edit → Fill. With nothing selected, it fills the whole layer.
- With the Rectangular Marquee, select the top of the canvas from the top-left corner down to
272. Fill it with black . - Select a strip across the bottom, from
1240to the bottom edge, and fill it with plum .
Old consoles couldn't blend colours smoothly, so skies were drawn in flat bands like these.
-
Make a checker tile for dithering
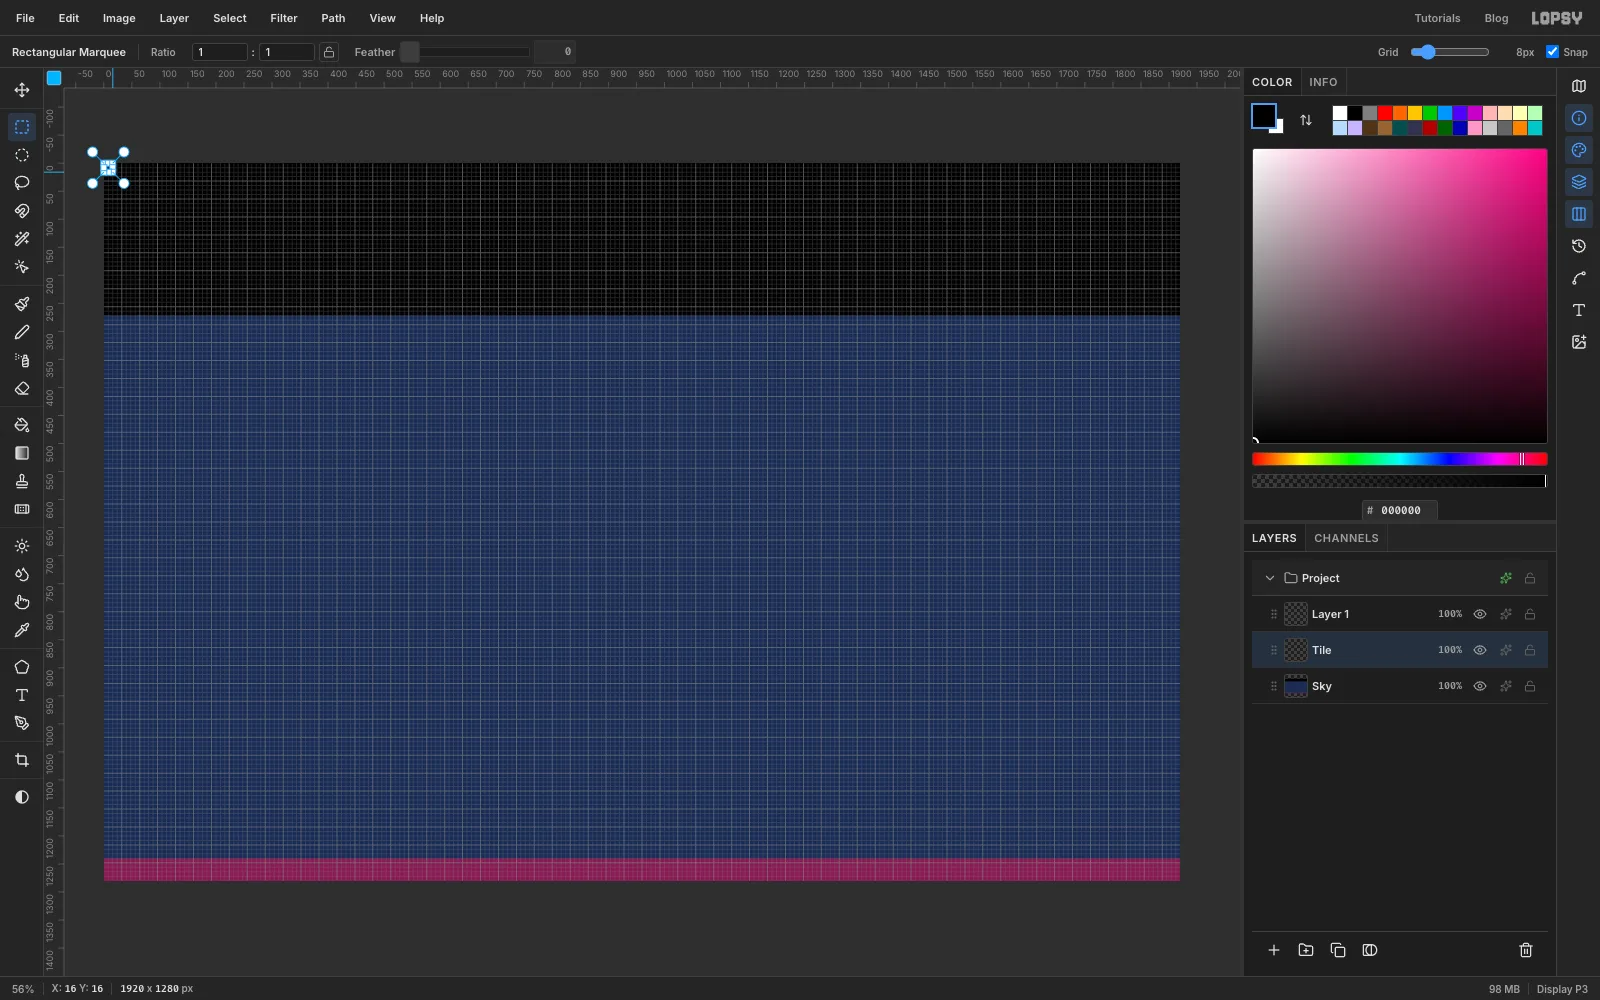
To soften the jump between two bands, 8-bit artists used dithering, a checkerboard of the two colours. You'll make one checker tile and reuse it all through the poster.
- Click Add Layer and name it
Tile. - Zoom into the top-left corner. Select the first cell (0 to 8 px) and Shift-drag the diagonal cell below and to the right of it, so you have two cells touching at a corner. Fill with black.
- Select the 16 × 16 square around both cells and choose Edit → Define Pattern. Lopsy saves it as Pattern 1.
- Delete the
Tilelayer with the trash button.
- Click Add Layer and name it
-
Dither the sky bands together
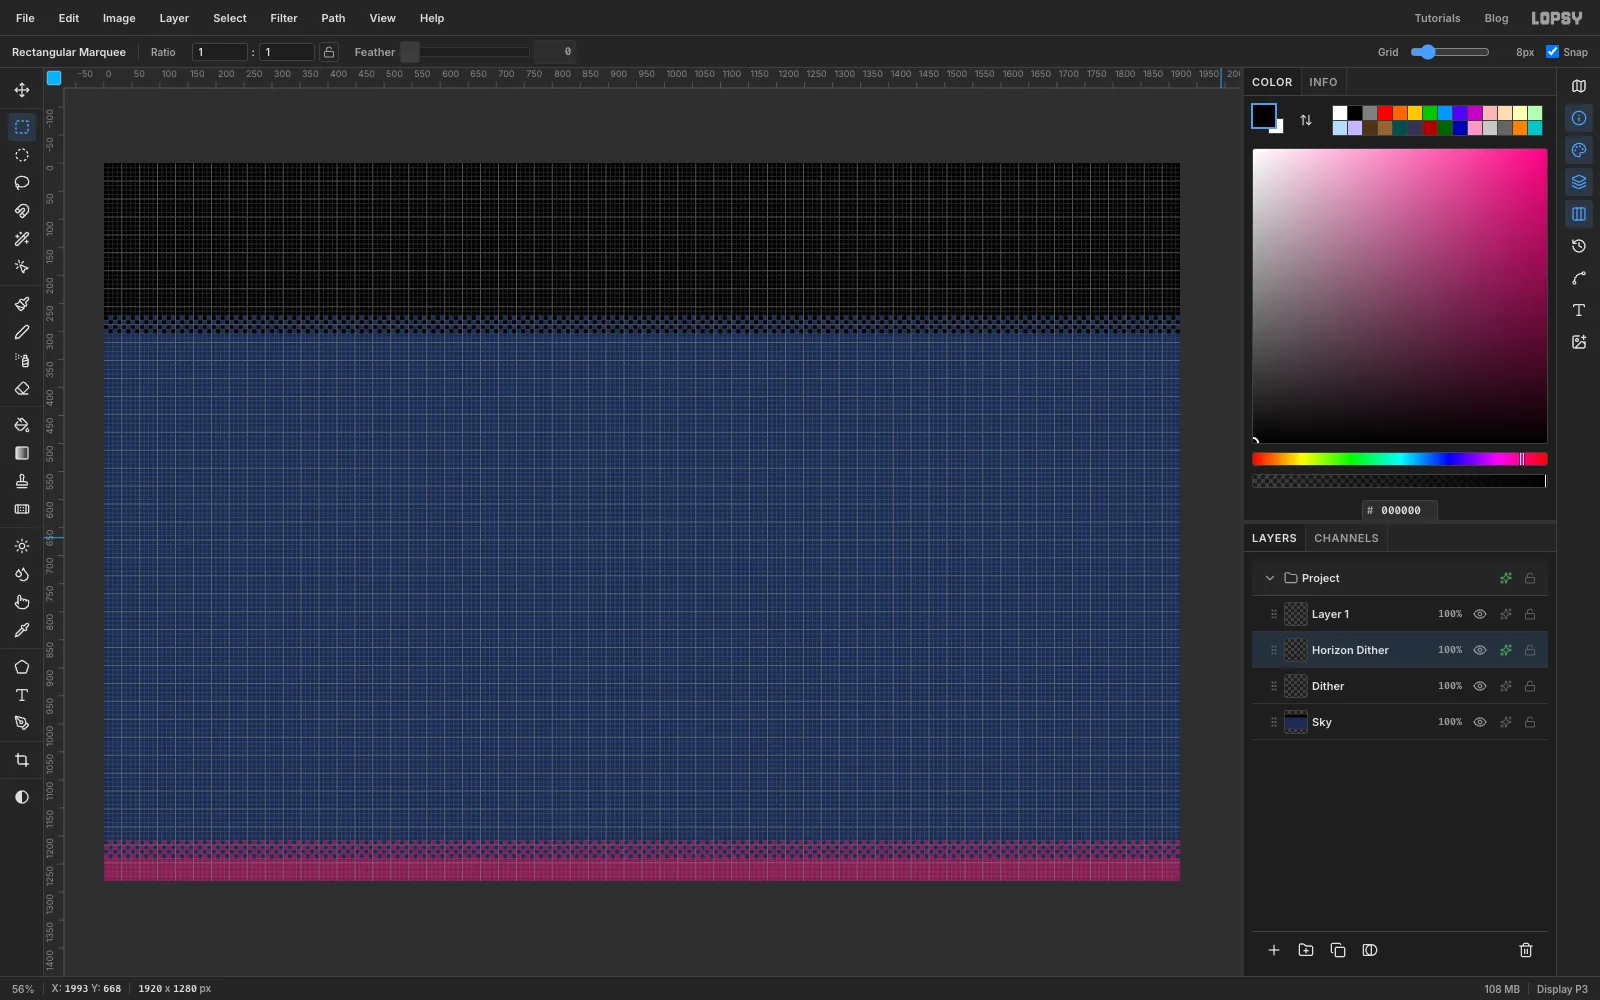
- Add a layer named
Dither. Select a strip from272to304across the full width, choose Edit → Fill with Pattern…, pick Pattern 1 and click Apply. Deselect with Cmd+D. - Add a layer named
Horizon Dither. Select the strip from1208to1240, just above the plum band, and fill it with Pattern 1 the same way. - The checker is black, so it needs recolouring for the horizon. Open the layer's effects (the fx button on its row), turn on Color Overlay and set it to plum .
Pattern fills line up with the canvas's top-left corner, and each 16 px tile holds exactly two cells, so the checks stay on the grid.
- Add a layer named
-
Scatter pixel stars
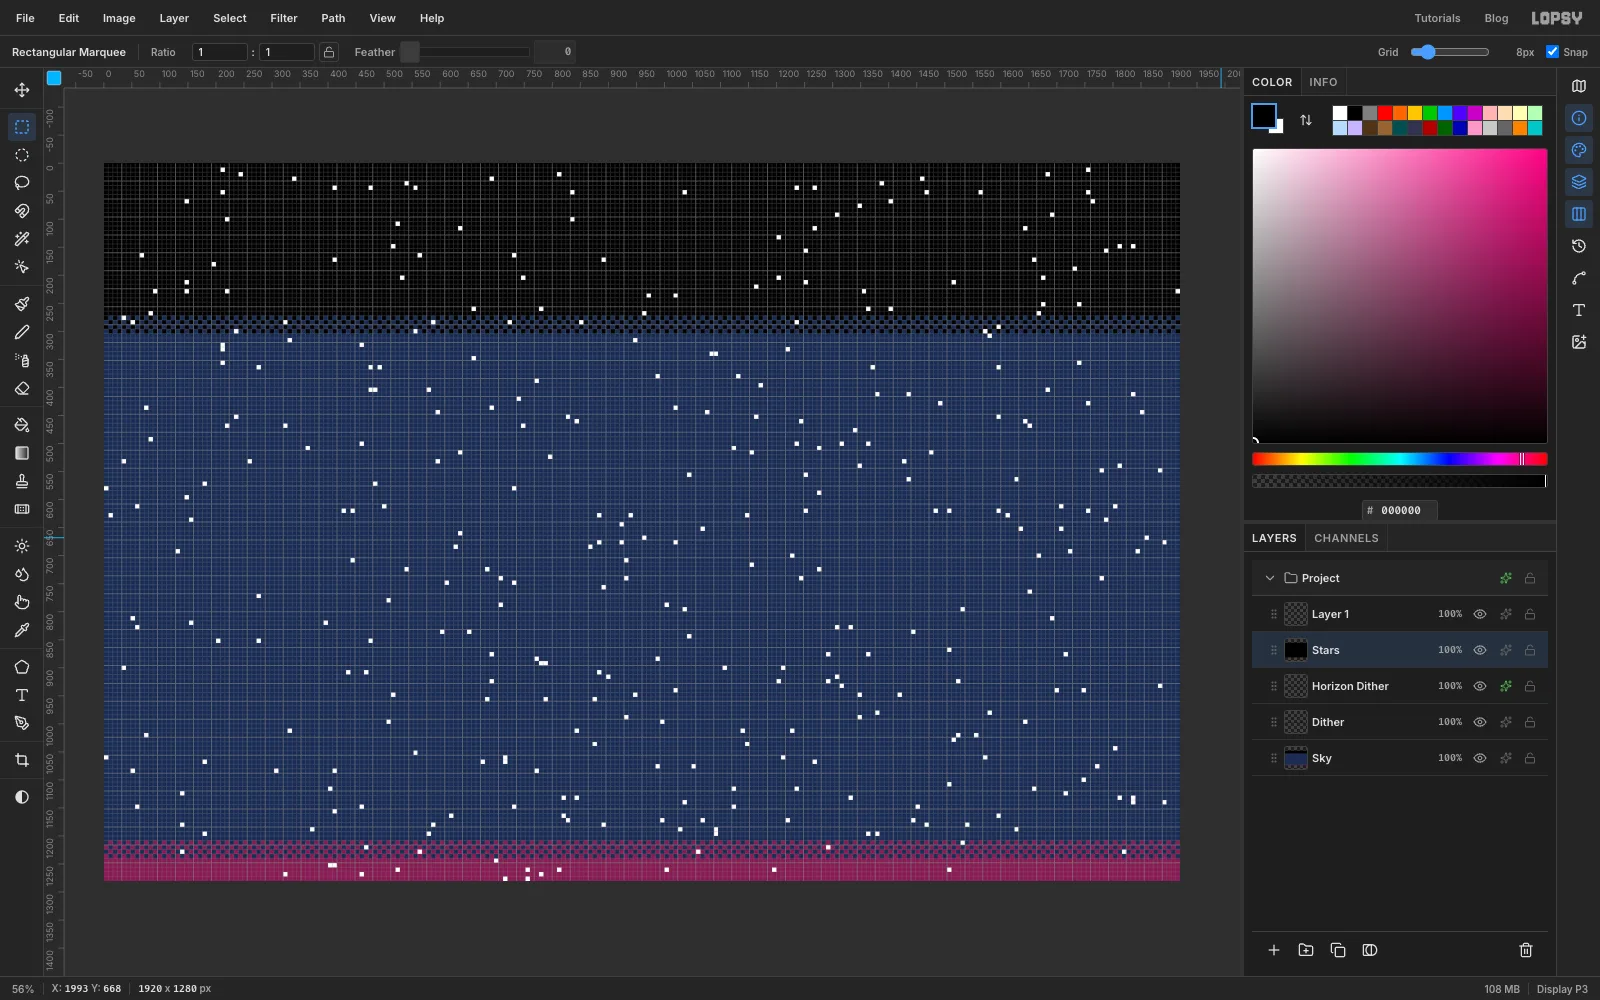
Stars come from noise, but noise is far too fine for an 8-bit sky. So you make it coarse, then clean it up.
- Add a layer named
Starsand fill it with black. - Choose Filter → Add Noise…, set Amount to
100, pick Mono and apply. - Filter → Threshold… at about
48keeps only the brightest specks, about 2 in every 100 pixels. - Filter → Pixelate… with Block Size
8averages the specks into grey grid cells. - Threshold again at about
17. Only cells that held several specks turn white, so you get roughly one star per hundred cells. - Set the layer's blend mode to Screen (in the effects drawer). Black disappears and only the stars stay.
Your stars will land in different places. That's fine, because noise is random every time.
- Add a layer named
-
Build the game window
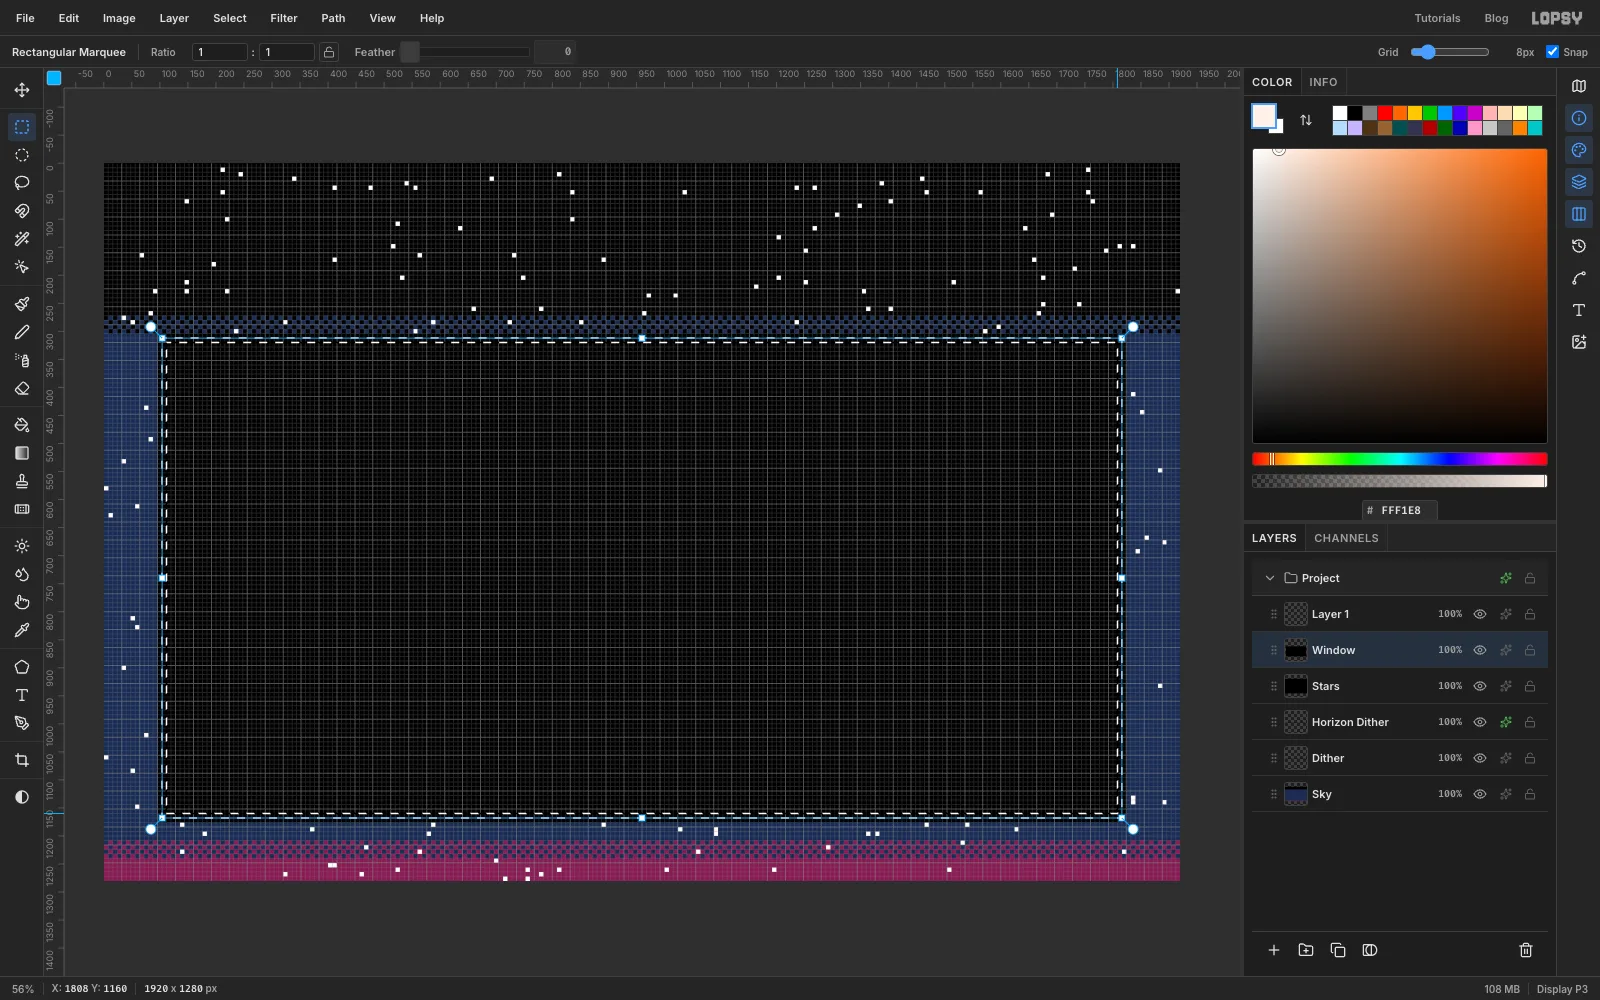
The chart sits in a game-style window: a black panel with a white border.
- Add a layer named
Window. Select from96, 304to1824, 1176and fill with black. - Select from
104, 312to1816, 1168. Then hold Alt and drag from112, 320to1808, 1160. Alt subtracts, which leaves a ring one cell wide. - Fill the ring with snow and deselect.
- Add a layer named
-
Group the backdrop
First delete the empty Layer 1 with the trash button; you've made your own layers. Then click
Skyand Shift-clickWindowto select all five backdrop layers. Choose Layer → Group Layers and rename the groupBackdrop. Collapse it with its arrow.With
Backdropselected, click New Group and name itChart. New layers you add whileChartis selected and expanded go inside it.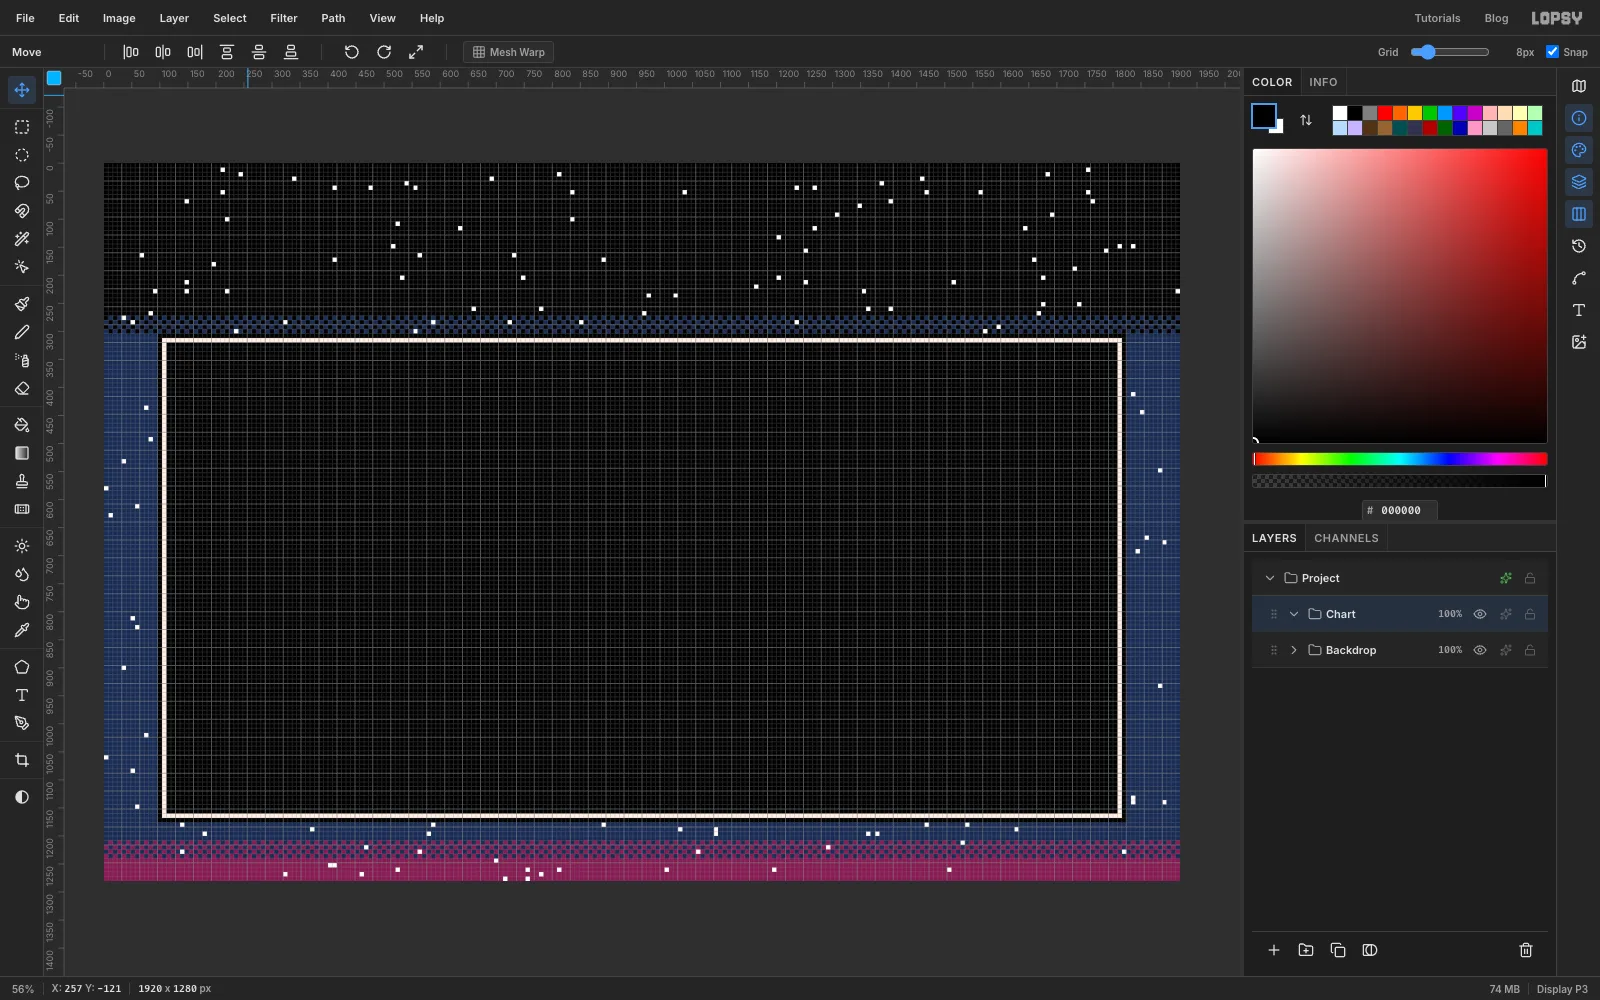
-
Draw dotted gridlines
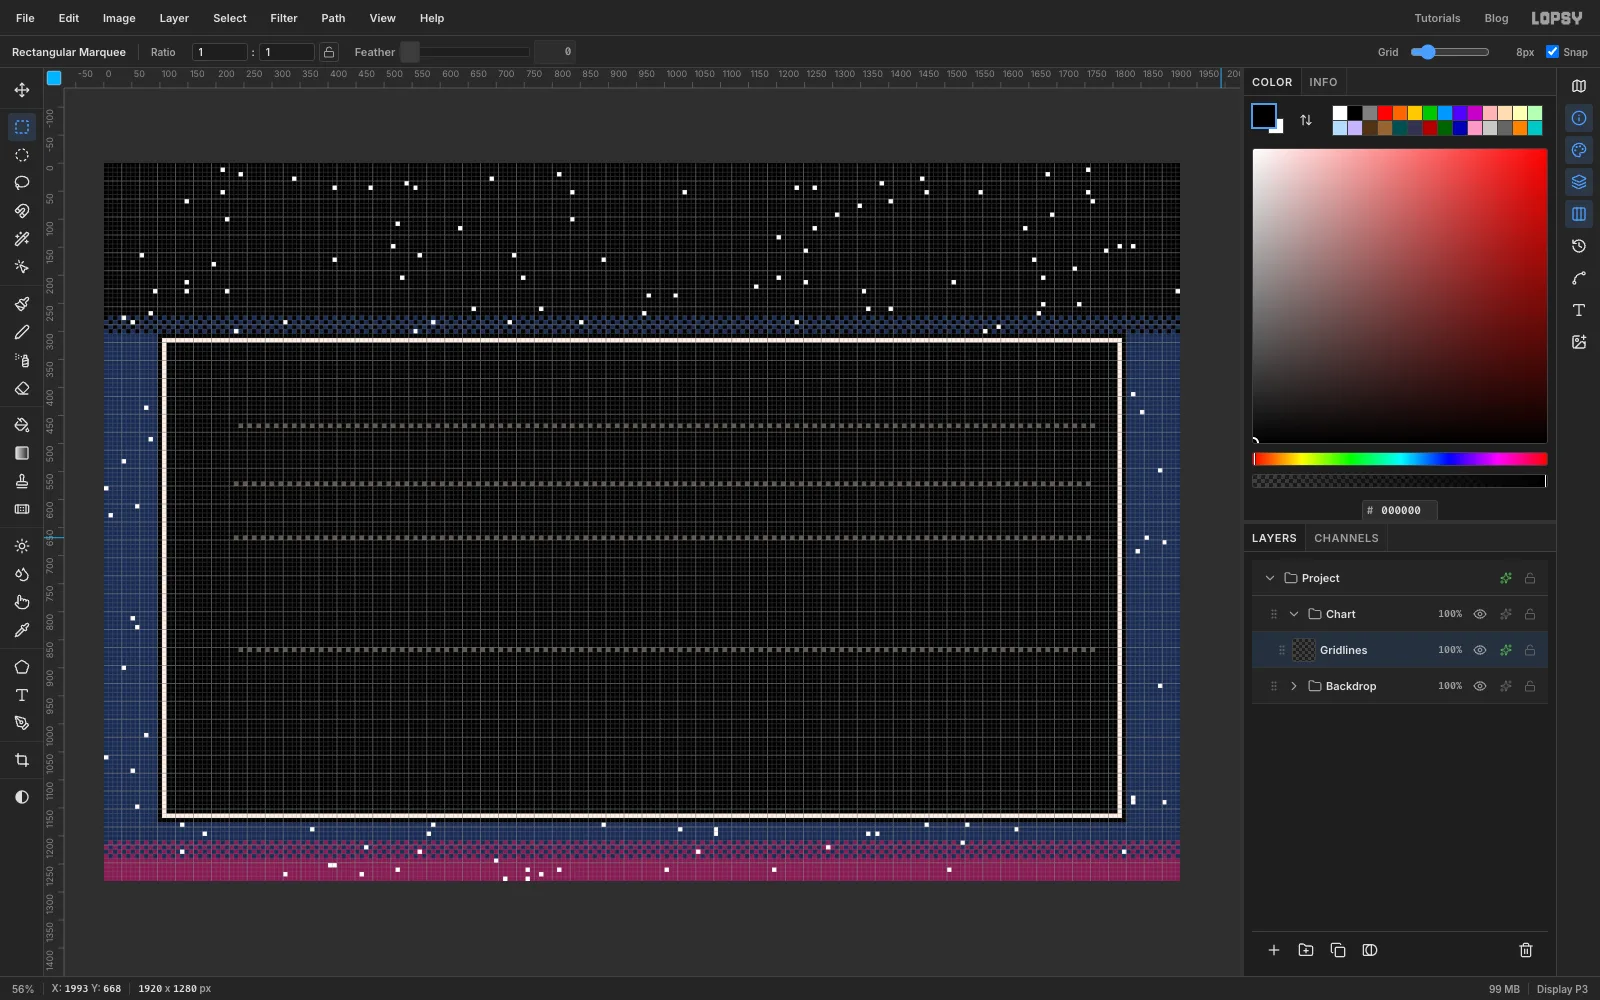
The scale is 20 px per million km², so 2.5 cells per million. The baseline (zero) is at
1064, which puts 10 at864, 20 at664and 30 at464. 25 works out to 564, half a cell off the grid, so round it to568.- Add a layer named
GridlinesinsideChart. - Select a strip one cell tall running from x
232to1768, with its top at864. Shift-add the same strip at664,568and464. - Fill with Pattern 1. A one-cell strip of a checkerboard is a dotted line.
- Deselect and give the layer a Color Overlay of slate , so the lines sit back behind the data.
- Add a layer named
-
Mark out one bar per year
Add a layer named
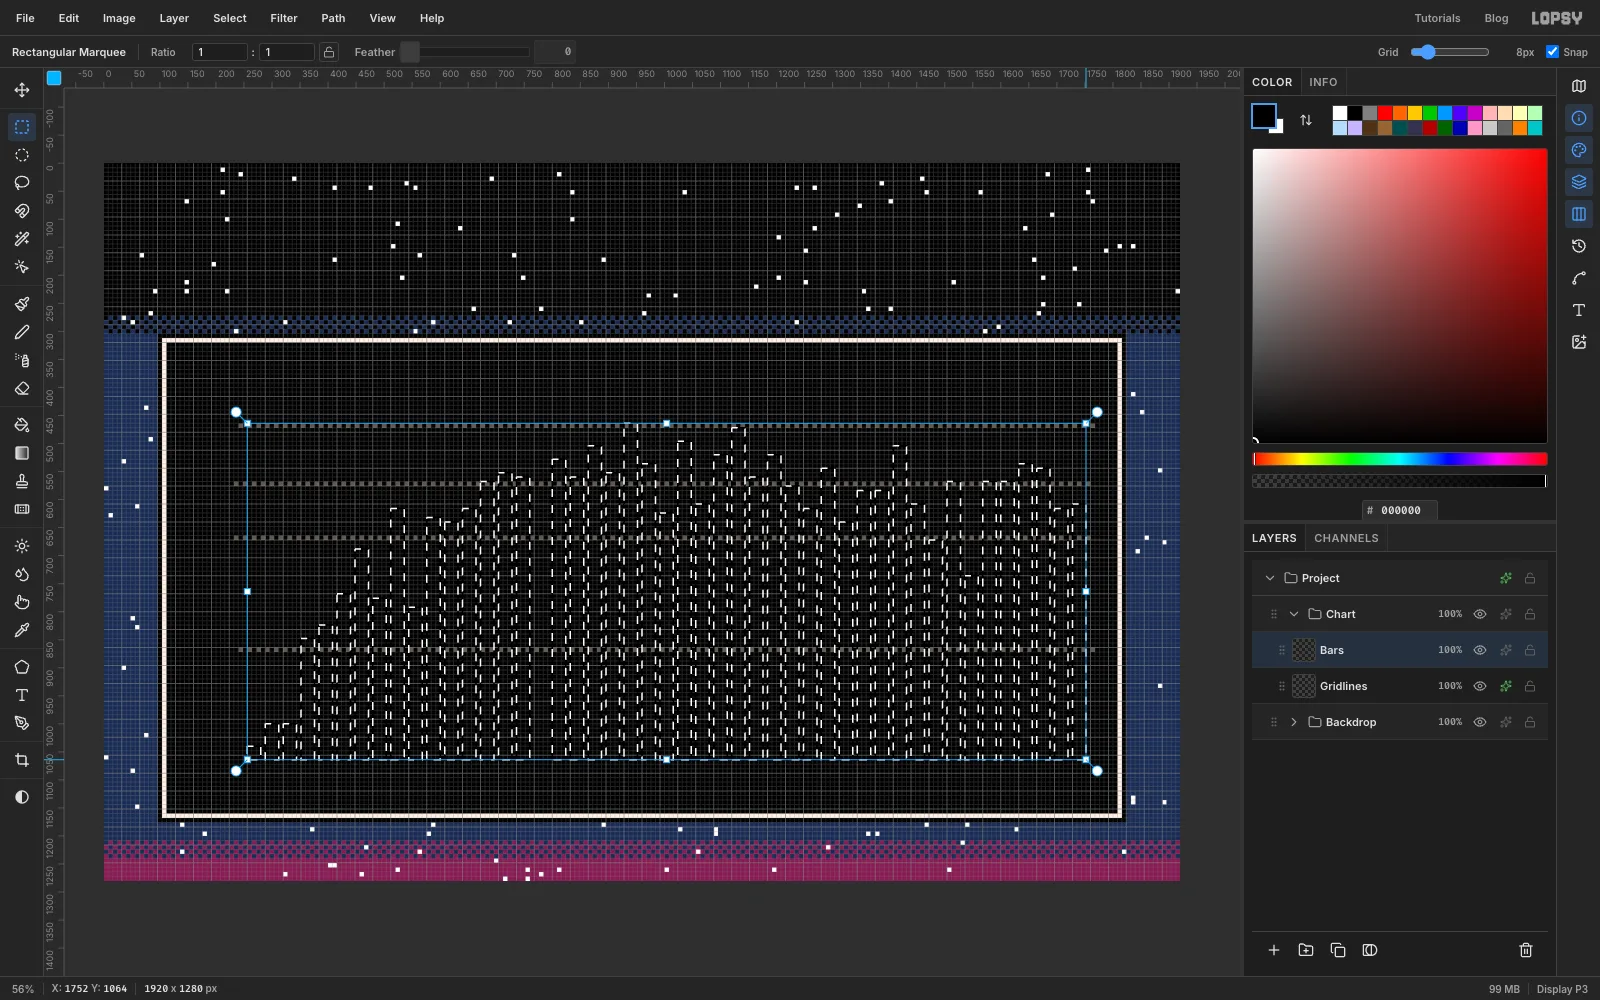
Bars. Each year gets a bar 3 cells (24 px) wide with a one-cell gap, so bars start every 32 px. 1979 starts at256, 1980 at288, and so on. Leave 1995's slot (768) empty, because there's no data for that year.Every bar stands on the baseline at
1064. Its height in cells is the area times 2.5, rounded, and its top is 8 px per cell above the baseline. Here are the tops, year by year:- 1979–1989: 1040, 1000, 1000, 848, 824, 768, 688, 776, 616, 792, 632
- 1990–1999: 640, 616, 568, 552, 560, (none), 528, 560, 504, 552
- 2000–2009: 464, 536, 624, 496, 608, 520, 472, 560, 520, 576
- 2010–2019: 616, 544, 640, 584, 584, 504, 608, 672, 568, 736
- 2020–2025: 568, 568, 536, 544, 616, 608
Drag the first bar with the Rectangular Marquee from its top-left corner down to the baseline, watching the Info panel for the top value. Hold Shift for every bar after it, so they add up into one selection. When all 46 are marked, fill them with snow and deselect.
-
Colour the bars by value
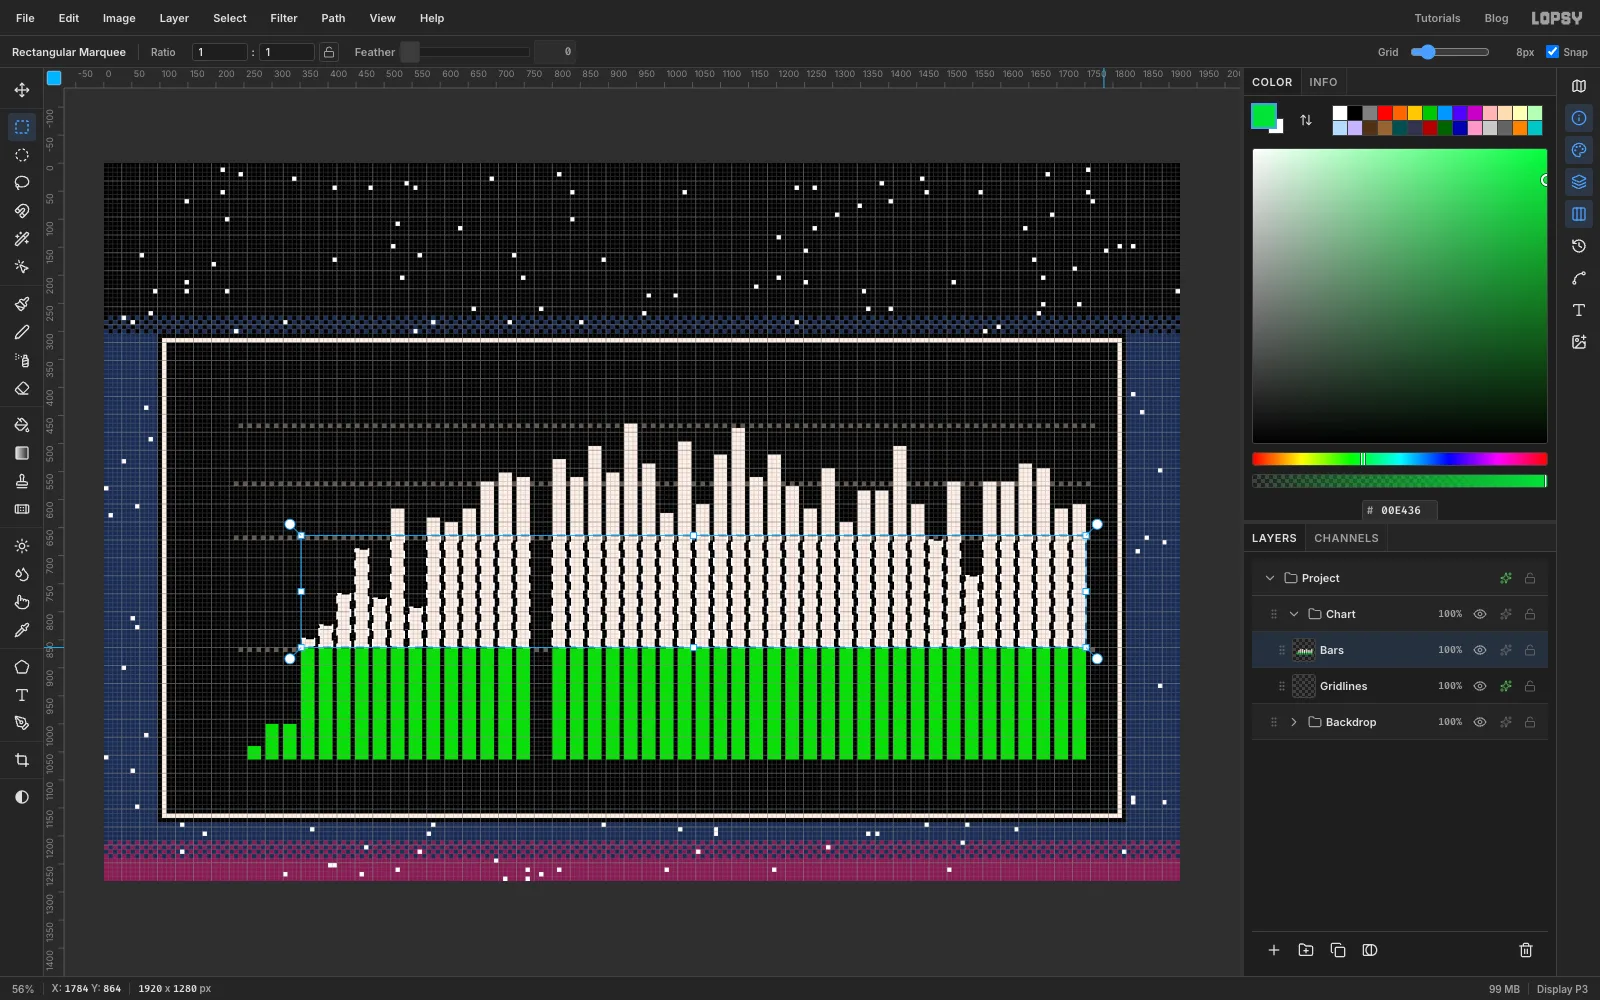
Each bar gets the colour of the band it reaches, like a power meter. Green is under 10, yellow 10–20, orange 20–25 and red over 25.
For each band:
- Cmd-click the
Barsthumbnail to load all the bars as a selection. - Hold Shift+Alt and drag a rectangle across the whole chart covering just that band. For green, that's
864to1064. Shift+Alt intersects, so only the parts of bars inside the band stay selected. - Fill with the band colour: green , yellow (
664–864), orange (568–664) and red (400–568).
The red rectangle starts above the tallest bar, so it catches every bar top over 25.
- Cmd-click the
-
Give the bars a pixel bevel
Pixel art fakes depth with a light edge and a dark edge.
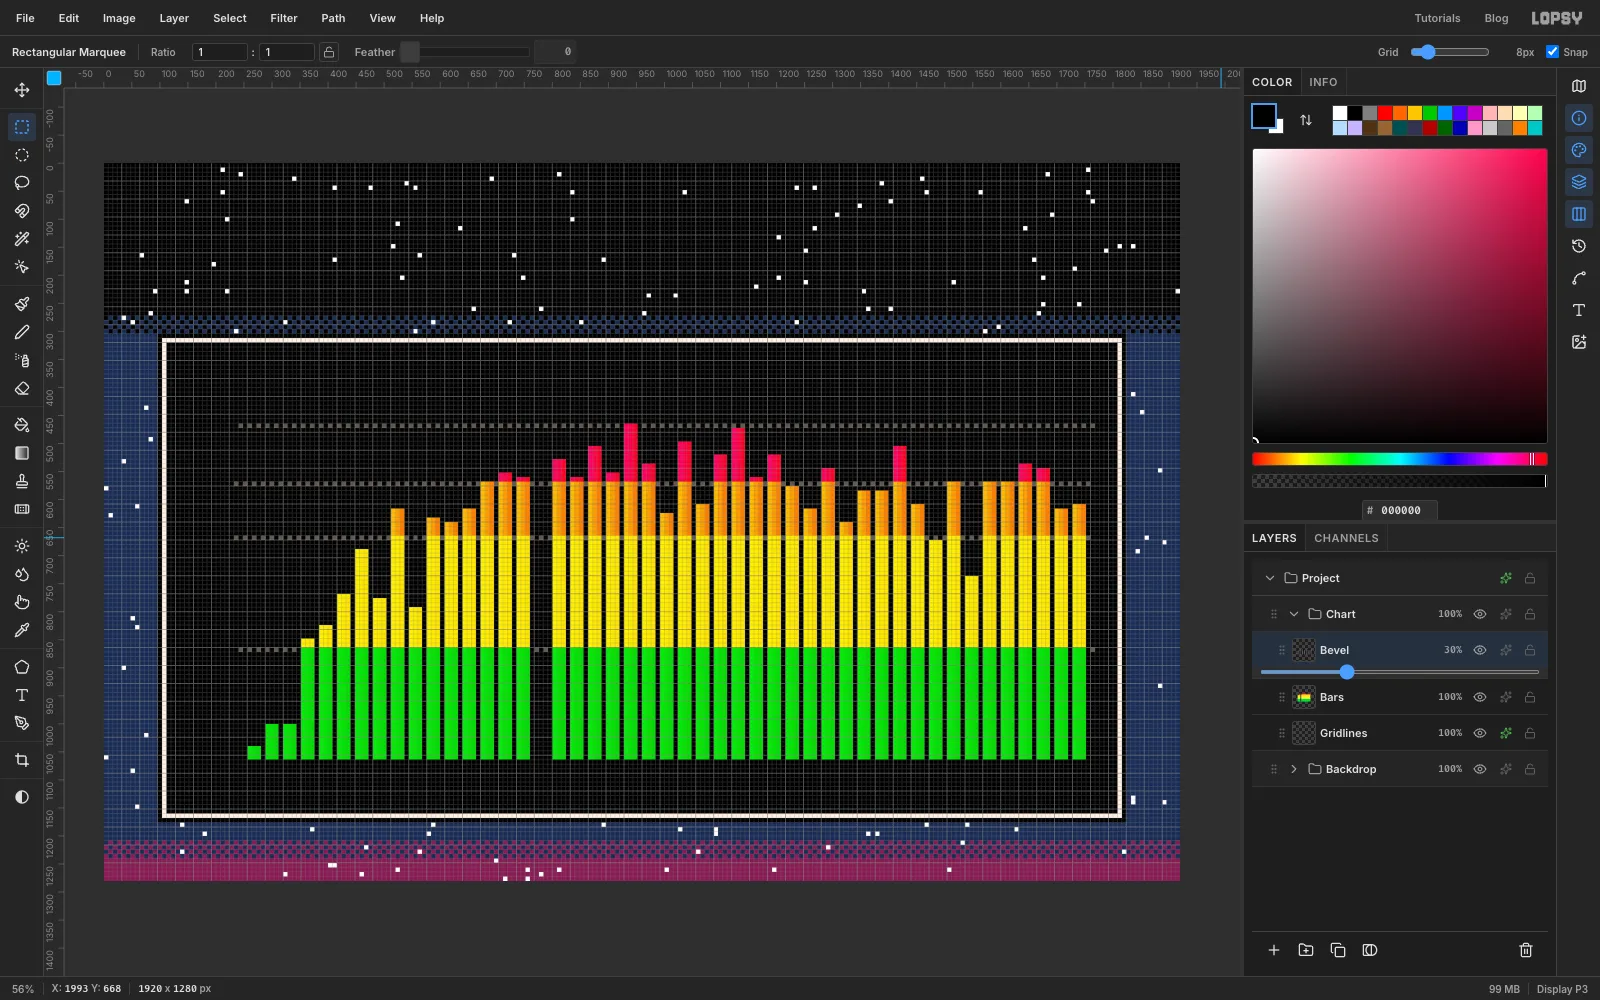
- Add a layer named
Bevel. In the top-left corner, fill the first cell (0–8, one cell tall) white, and the third cell (16–24) black. - Select from
0, 0to32, 8and Define Pattern. That's Pattern 2. Press Delete to clear the tile and deselect. - Cmd-click the
Barsthumbnail, then Fill with Pattern with Pattern 2. The tile is 32 px wide, the same as the bar spacing, so every bar gets a light left column and a dark right column. - Set the layer to Overlay at
30%opacity. Any stronger and the orange starts to look red.
- Add a layer named
-
Lay an ice-brick floor
The level needs a floor.
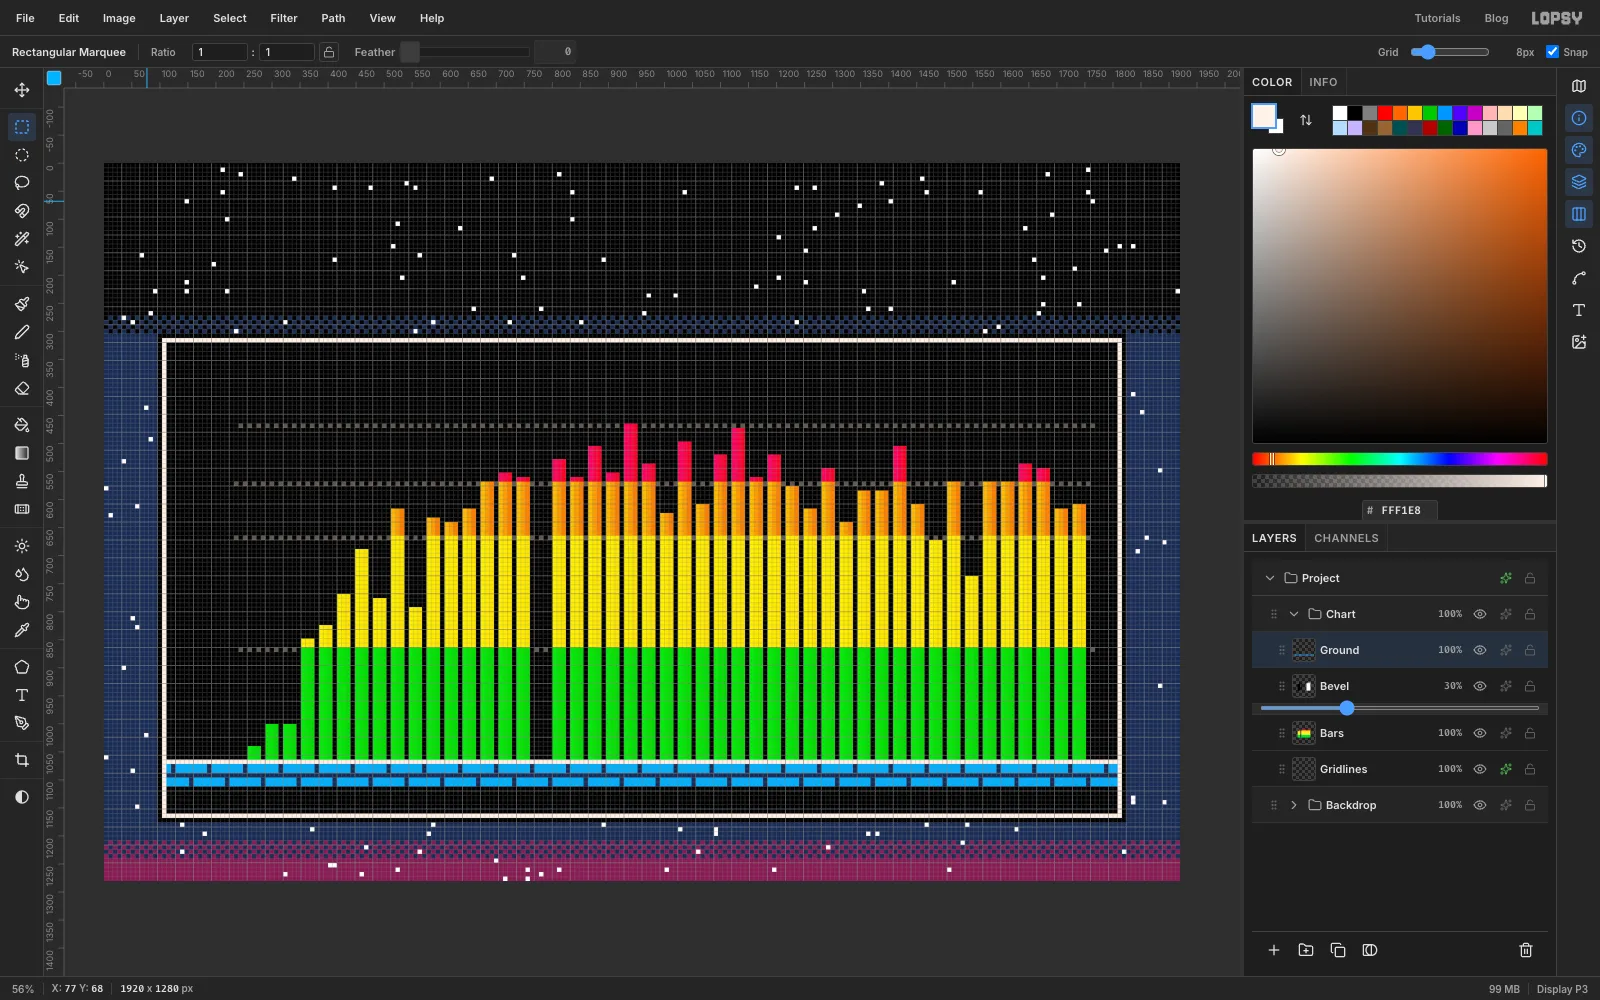
- Add a layer named
Ground. In the top-left corner, select0, 0to64, 48and fill it sky blue . - Draw the mortar in navy as one Shift-added selection. Add two horizontal rows across the tile, at y
8–16and y32–40. Then add the vertical joints, each one cell wide: x56–64in the brick strip between the rows (y16–32), and x24–32in the strips above and below them (y0–8and y40–48). Fill it. - Select the whole 64 × 48 tile and Define Pattern (Pattern 3). Delete the tile and deselect.
- Select the floor from
112, 1072to1808, 1112and fill it with Pattern 3. The rows of bricks are offset like a real wall. - Select the cell row along the top,
1064to1072, and fill it snow .
- Add a layer named
-
Add the no-data block and year ticks
- Add a layer named
No Data Block. Fill the 1995 slot from768, 1032to792, 1064silver . Fill its right column and bottom row slate for a shadow. It's grey on purpose, so nobody reads it as a data bar. - Add a layer named
Ticks. Under the floor, Shift-select a one-cell tick (1112–1120) centred under 1980, 1990, 2000, 2010, 2020 and 2025. Those are the cells at296,616,936,1256,1576and1736. Fill them silver.
Collapse the
Chartgroup.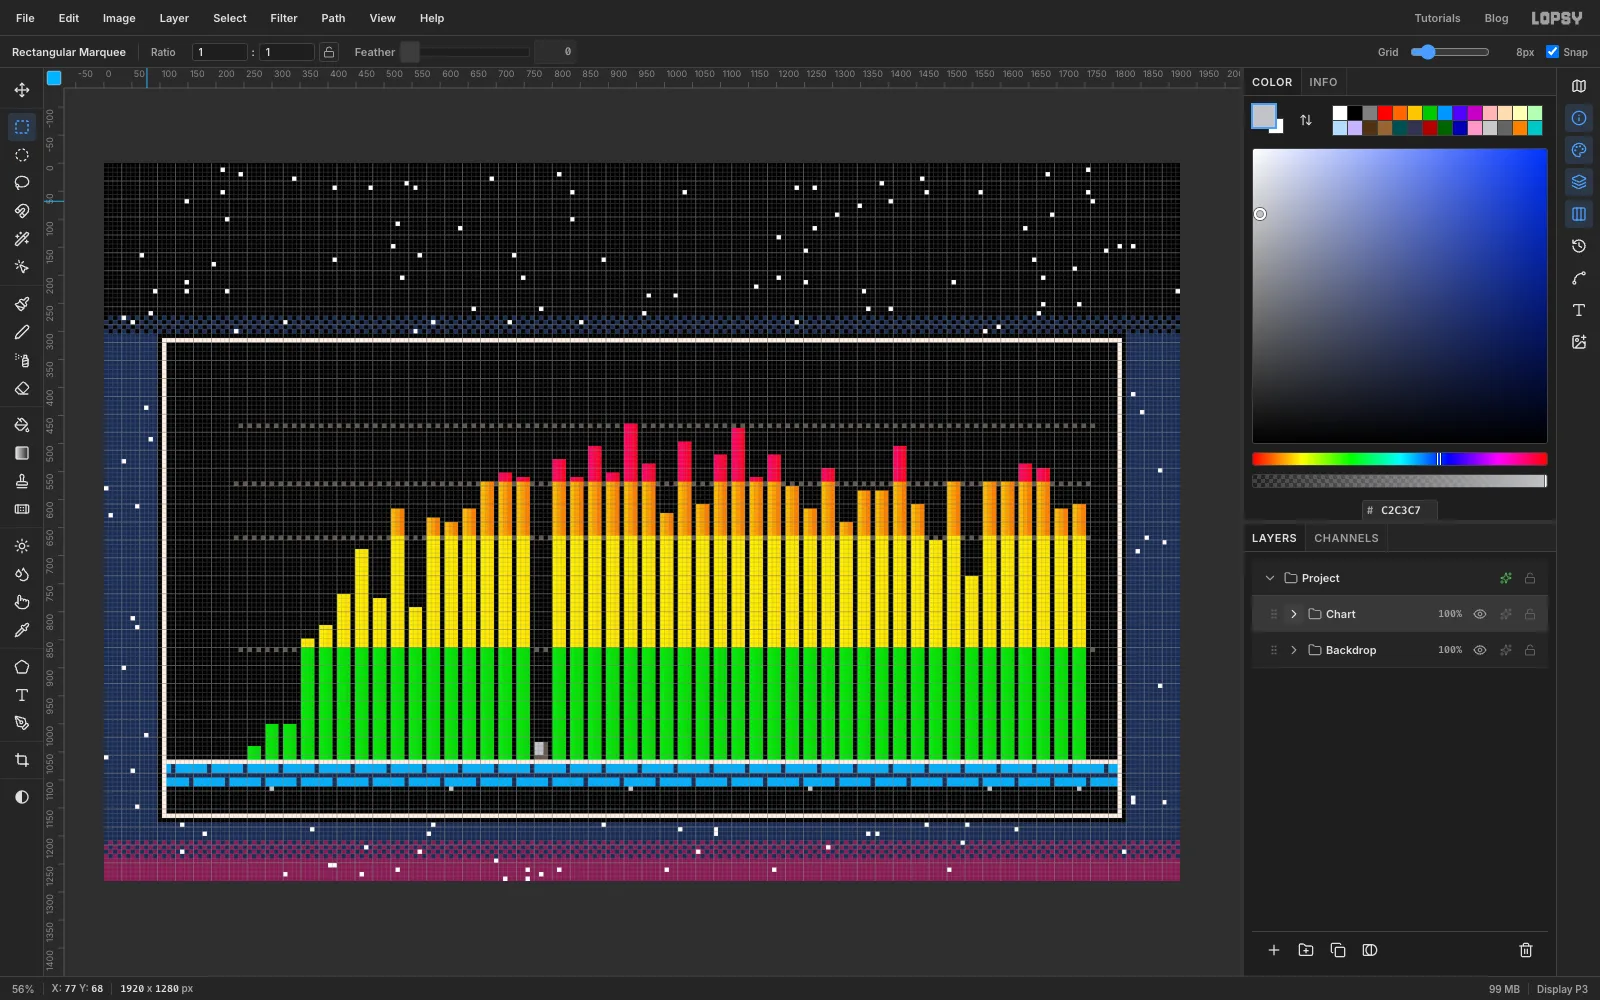
- Add a layer named
-
Make a pixel-perfect circle with a stencil
Pixelate keeps a shape's outline smooth: it only averages the colours inside it. To get the stair-stepped edge of real pixel art, use a throwaway stencil. You'll repeat this trick for every round sprite.
Select
Chart, click New Group and name itSprites. Add a layer namedEarth Outline. Then make the stencil:- Add a layer named
Stenciland fill it black. - With the Elliptical Marquee, draw a circle centred at
1696, 152with a radius of112(from1584, 40to1808, 264). Fill it white and deselect. - Pixelate at
8, then Threshold at128. Every cell is now pure black or pure white. - Pick the Magic Wand, untick Contiguous, and click the white circle. You now have a stepped circle selection.
- Delete the
Stencillayer. The selection stays.
Select
Earth Outlineand fill the selection snow . It will show as a one-cell rim once the Earth sits on top.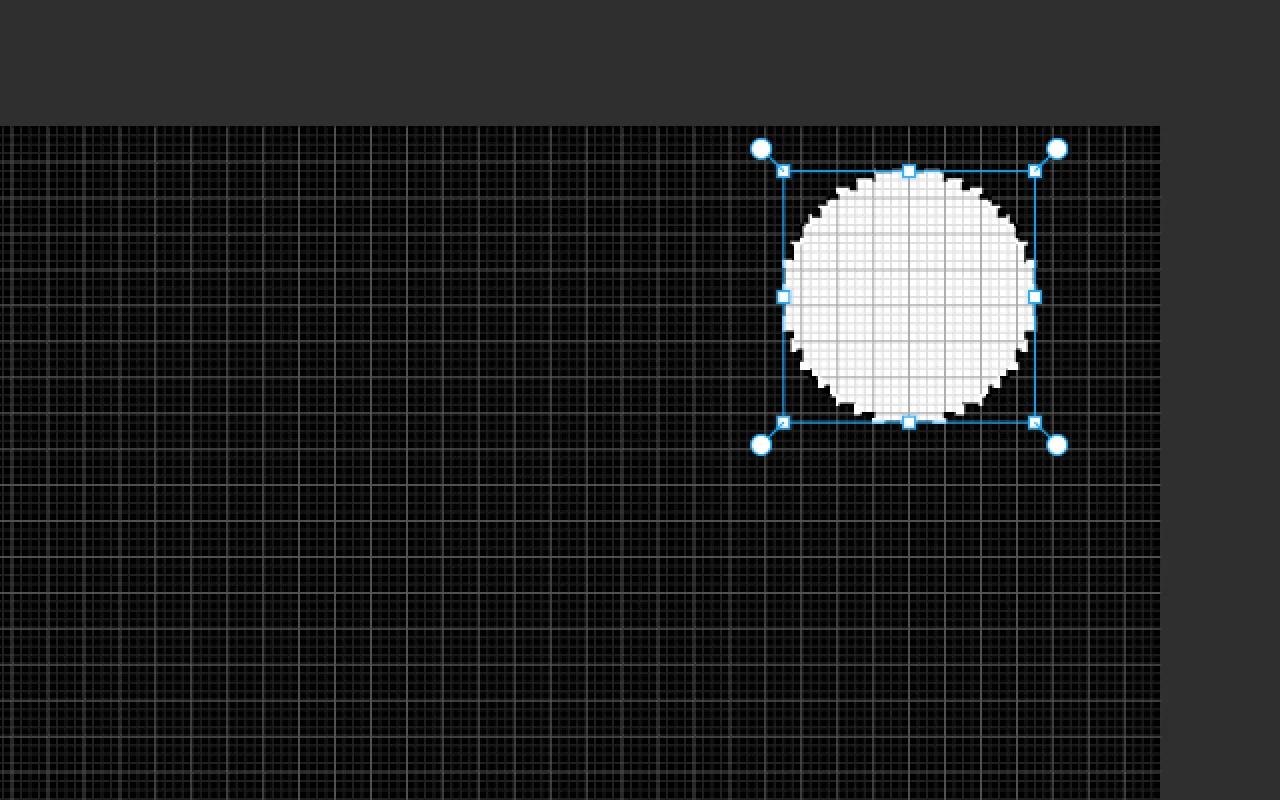
- Add a layer named
-
Paint the Earth
Add a layer named
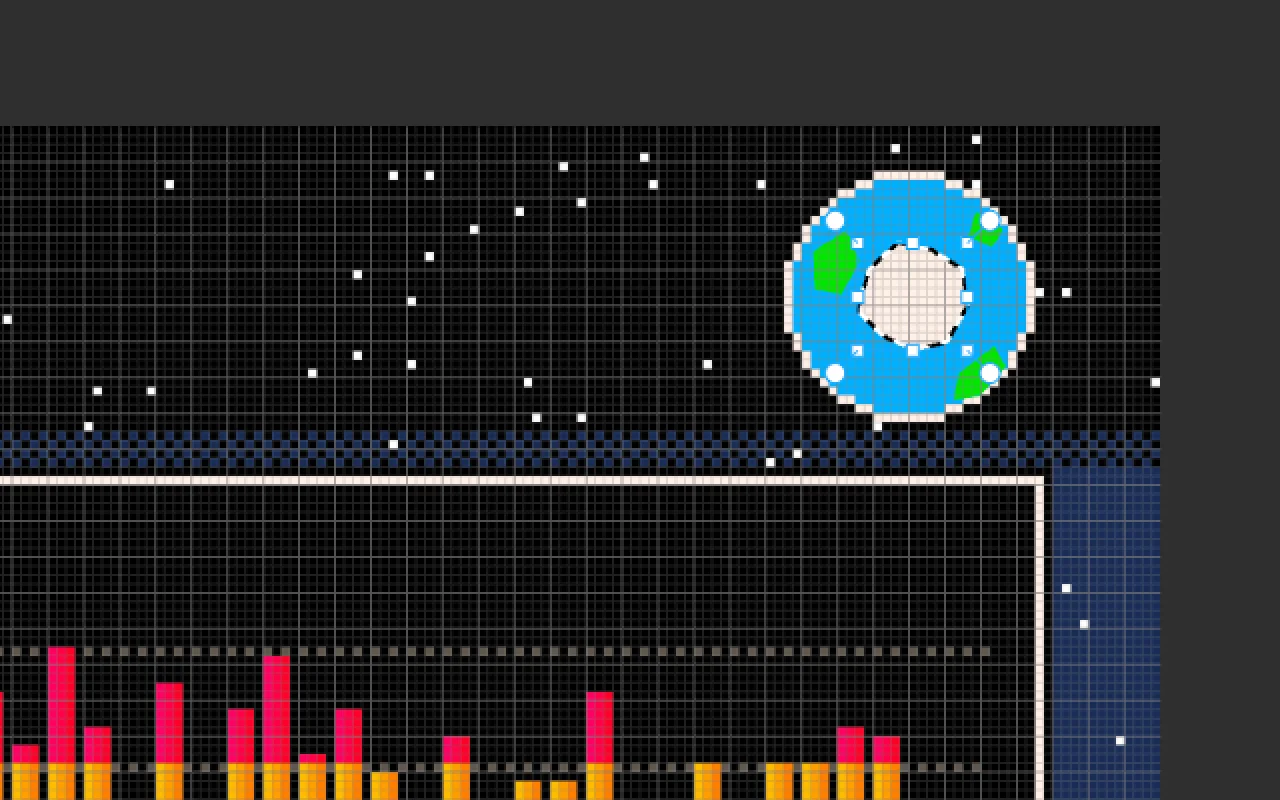
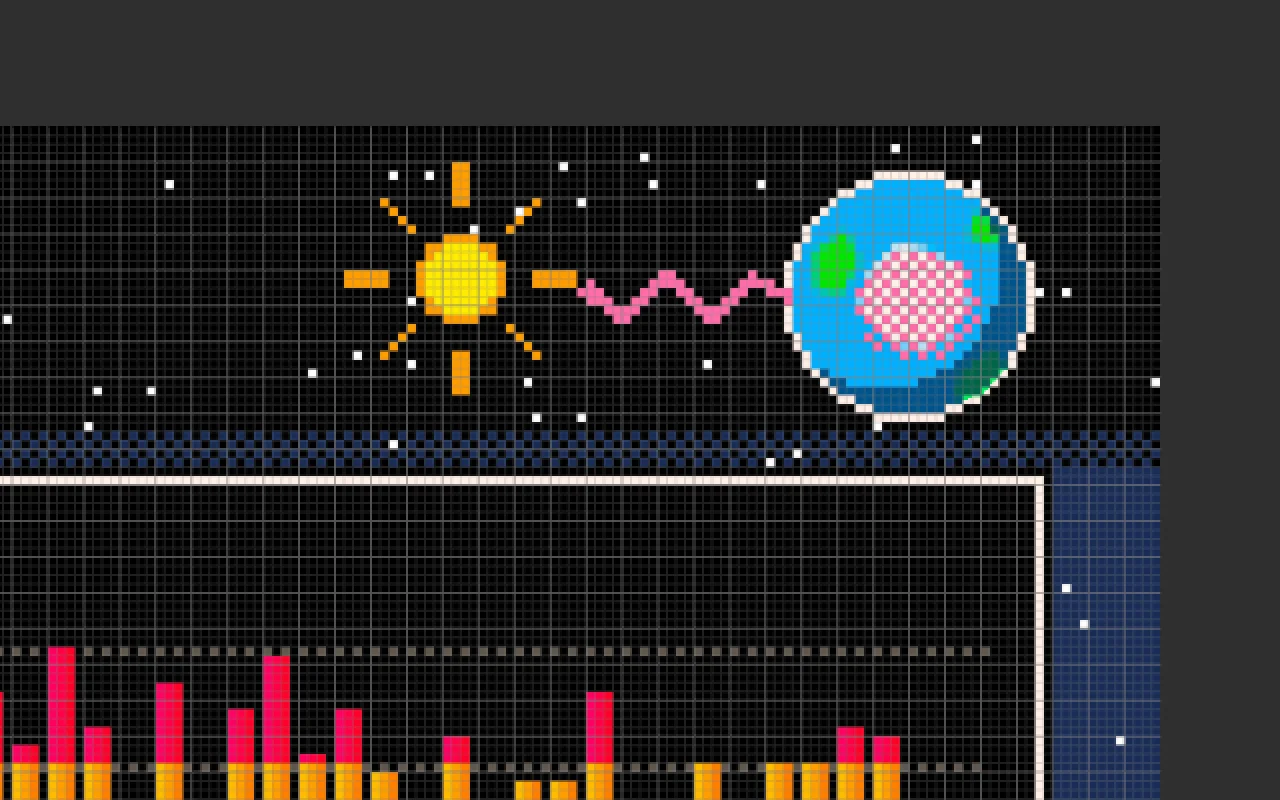
Earthand make another stencil the same way, a circle of radius104at the same centre. Fill it sky blue .This is the Earth seen from below the South Pole. Antarctica sits in the middle, and the tips of the other continents peek in at the edge.
- With the Lasso, draw three small blobs near the rim, at the upper left, upper right and lower right. Fill each green .
- Lasso a rounded, slightly lumpy shape about 100 px across in the centre for Antarctica, and fill it snow.
- Deselect.
-
Pixelate the Earth
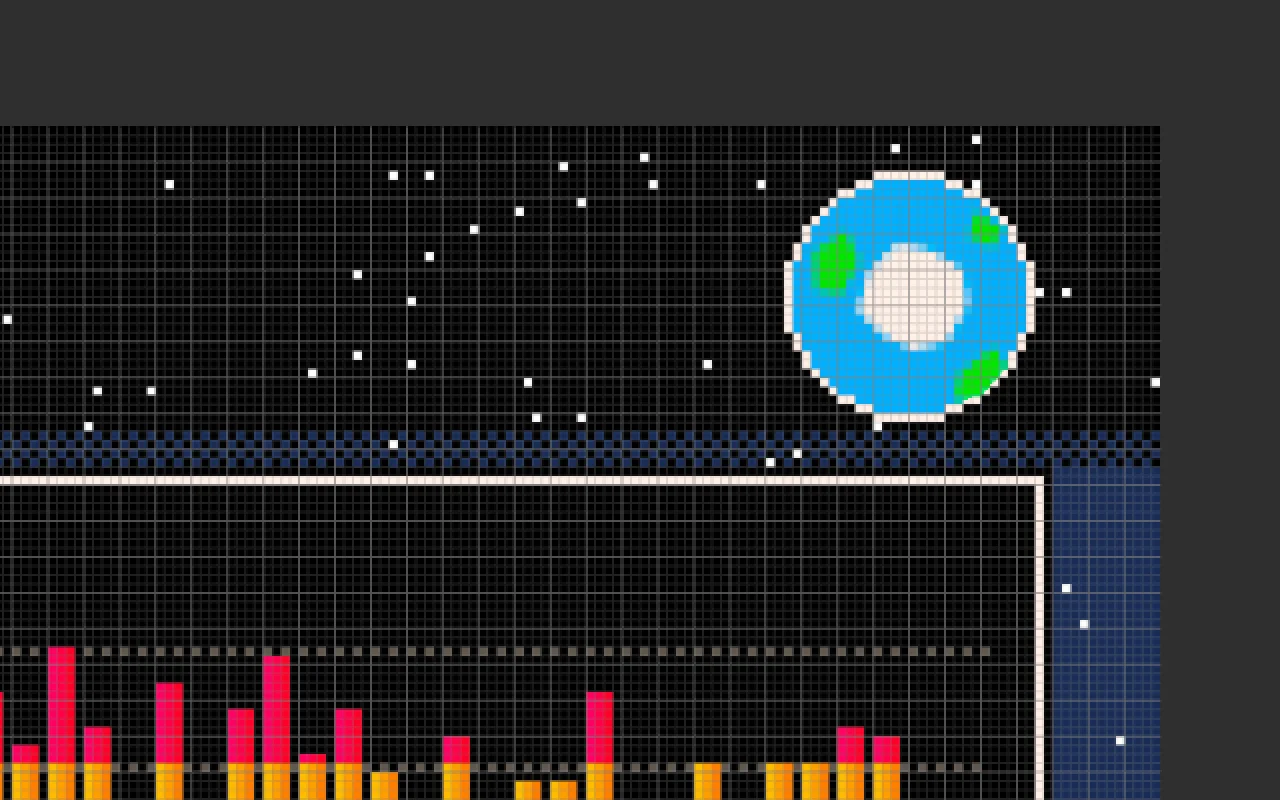
Pixelate
Earthat8.The edge was already stepped by the stencil. Now the inside is chunky too, and the continents become little clusters of cells. Cells along Antarctica's coast average into in-between blues. On a planet that reads as shallow ice, so leave them.
-
Shade the night side
Add a layer named
Earth Shade. Make a crescent stencil:- Add a black
Stencillayer, and draw a white circle of radius104at1696, 152, the same as the Earth. - Draw a second circle of the same size centred three cells up and three cells left, at
1672, 128, and fill it black. A white crescent is left at the lower right. - Pixelate
8, Threshold128, Magic Wand the crescent, and delete the stencil.
Fill the crescent navy on
Earth Shadeand set that layer to70%opacity. Some of the land shows through the shadow.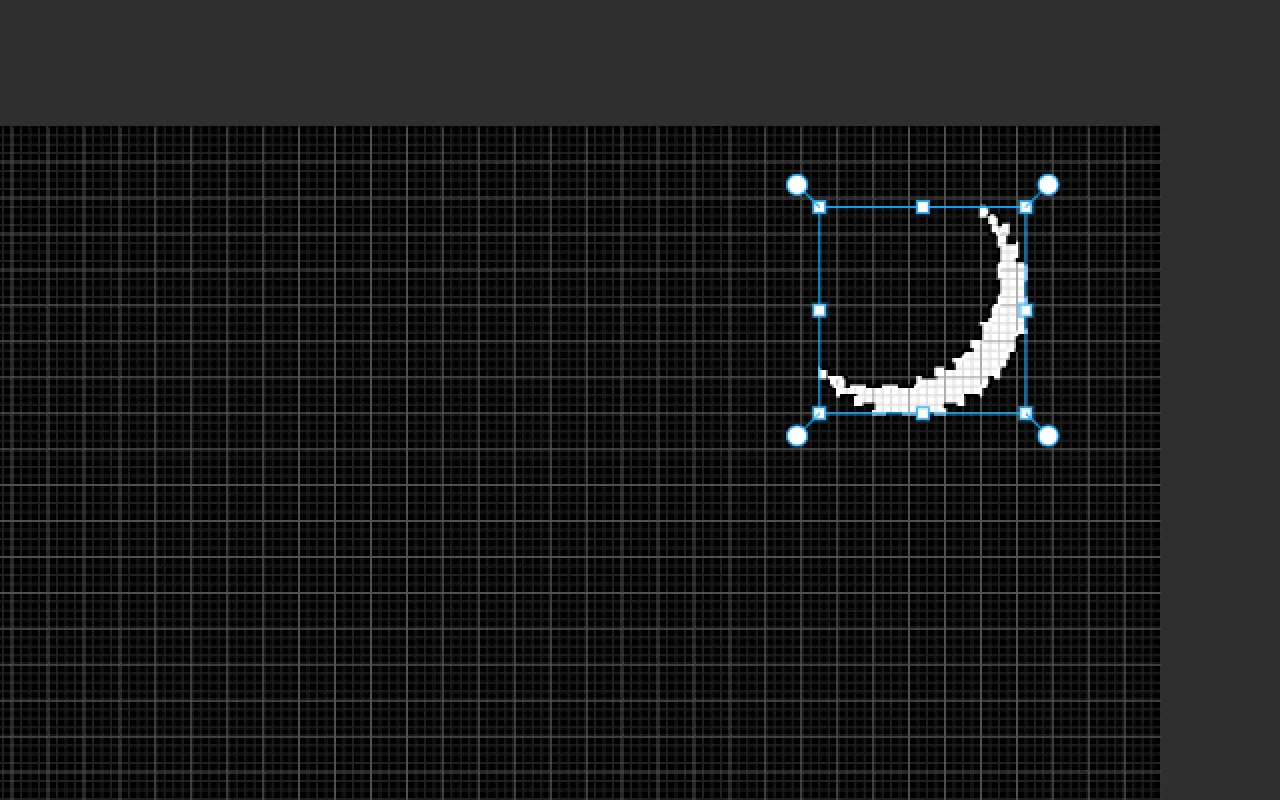
- Add a black
-
Dither the ozone hole
The hole should look thin, not solid, so draw it with the checker.
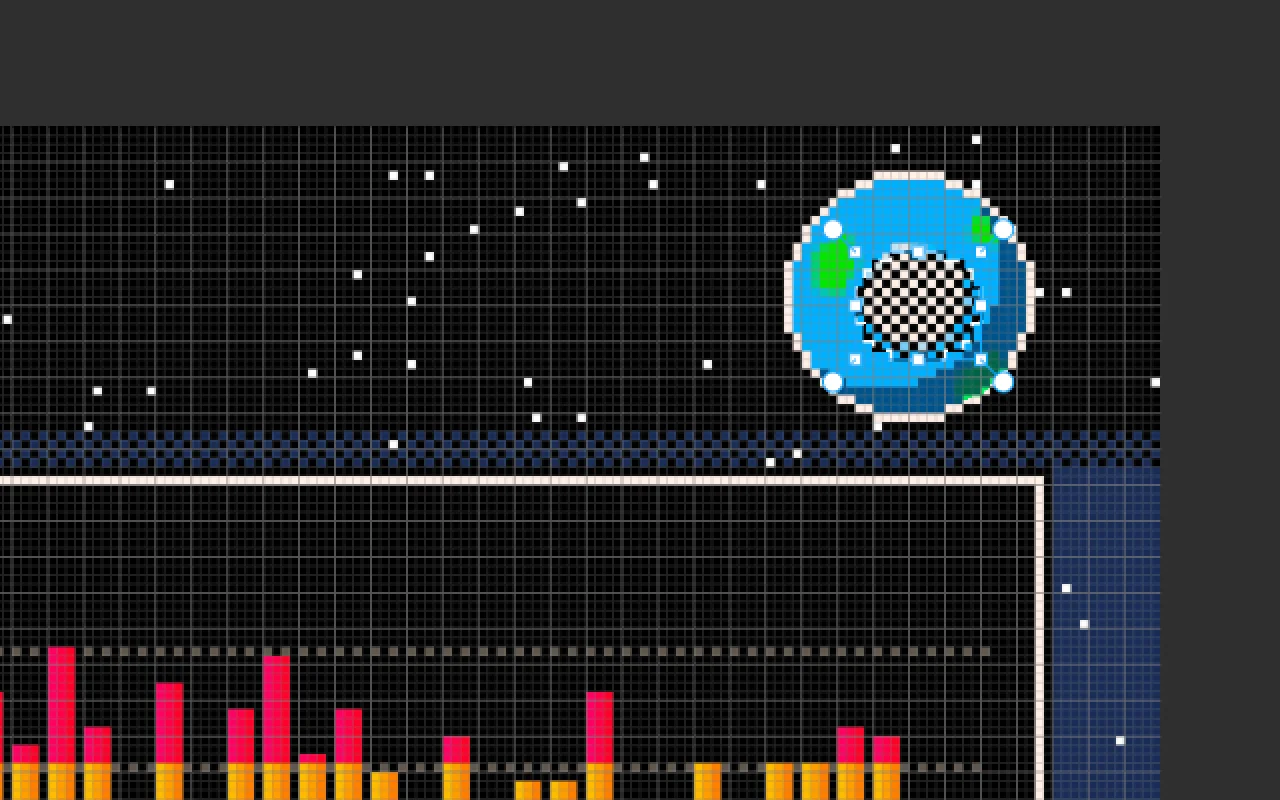
- Add a layer named
Ozone Hole. Make a stencil of an oval over Antarctica, from about1648, 104to1752, 208, and Magic Wand it. - Fill with Pattern using Pattern 1, the checker.
- Deselect and add a Color Overlay in pink .
Half the cells are pink and half let Antarctica through. That's how 8-bit games drew see-through things.
- Add a layer named
-
Rotate copies of the sun's rays
Add a layer named
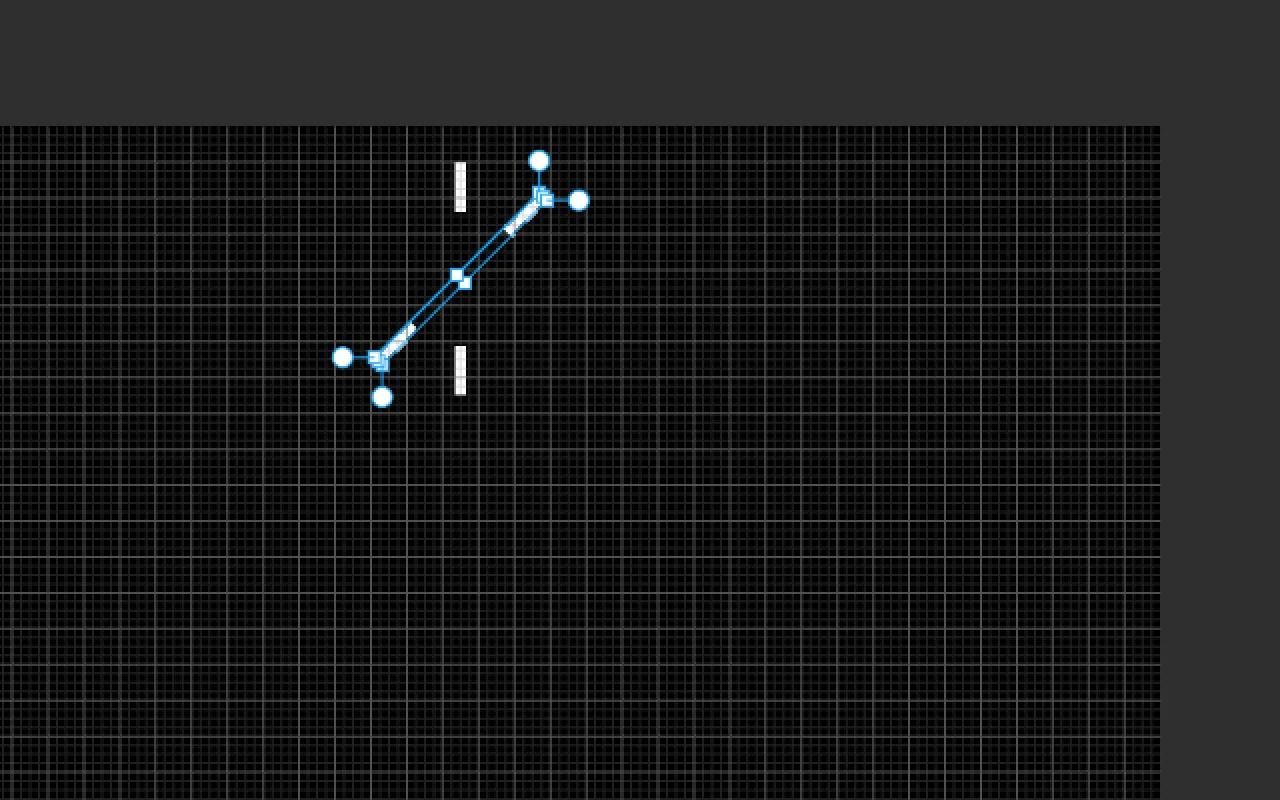
Rays. Turn off Snap for this step. You want 10 px bars centred on the sun's axis, which the grid won't allow, and that thin source is what turns the diagonals into neat single-cell staircases later.- Add a black
Stencillayer. Draw two thin white bars, about 10 px wide and 44 px long: one above the sun's centre at1296, 136, running from32to76, and one below it, from196to240. - With the bars still selected, press Cmd+C, then Cmd+V. The copy pastes in place on a new layer, selected, with the Move tool active.
- Drag the round rotate handle just outside the top-right corner. Hold Cmd to snap the angle, and stop at 45°. Deselect.
- Paste twice more, rotating one copy to 90° and the other to 135°.
- Choose Layer → Merge Down three times to merge the copies into the stencil.
Turn Snap back on.
- Add a black
-
Snap the rays to the grid
Finish the stencil as usual: Pixelate
8, Threshold128, then Magic Wand one ray with Contiguous off, so all eight are selected. Delete the stencil.The straight rays come out two cells thick. The diagonals become single-cell staircases, the classic pixel-art 45° line. Fill the selection orange on
Rays.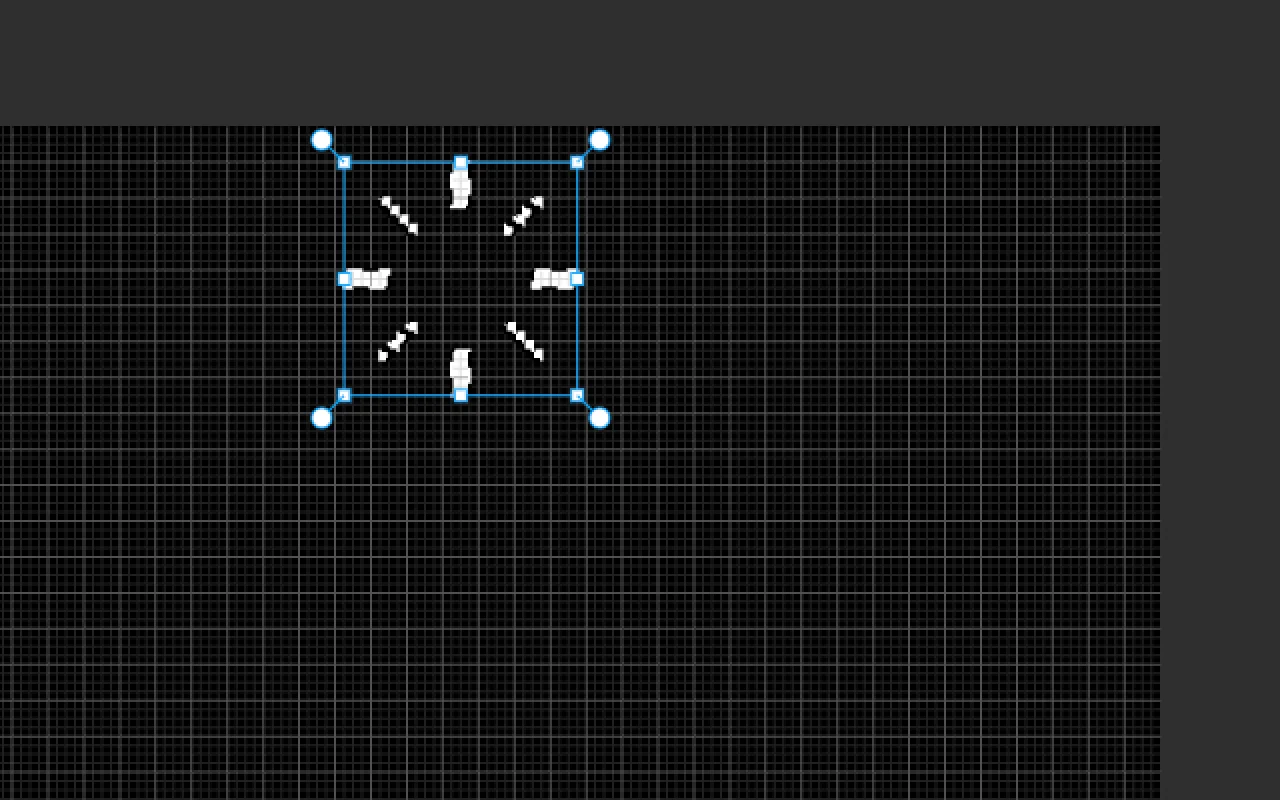
-
Light the sun and fire the UV
- Add a layer named
Sun. Stencil a circle of radius40at1296, 136and fill it orange. Then stencil a circle of radius32at the same centre and fill it yellow . This leaves an orange rim one cell wide. - Add a layer named
UVand a blackStencillayer. Pick the Pencil at Size10in white. Click at1408, 144, just past the sun's right ray. Then Shift-click1440, 172,1480, 132,1520, 172,1556, 136and finally the Earth's rim at1588, 152. Each Shift-click draws a straight line from the last point, so you get a zig-zag about 40 px tall. - Pixelate, Threshold and Magic Wand it. Delete the stencil, and fill the zig-zag pink.
Pink is saved for the bad things: the hole and the UV that gets through it.
- Add a layer named
-
Draw the penguin
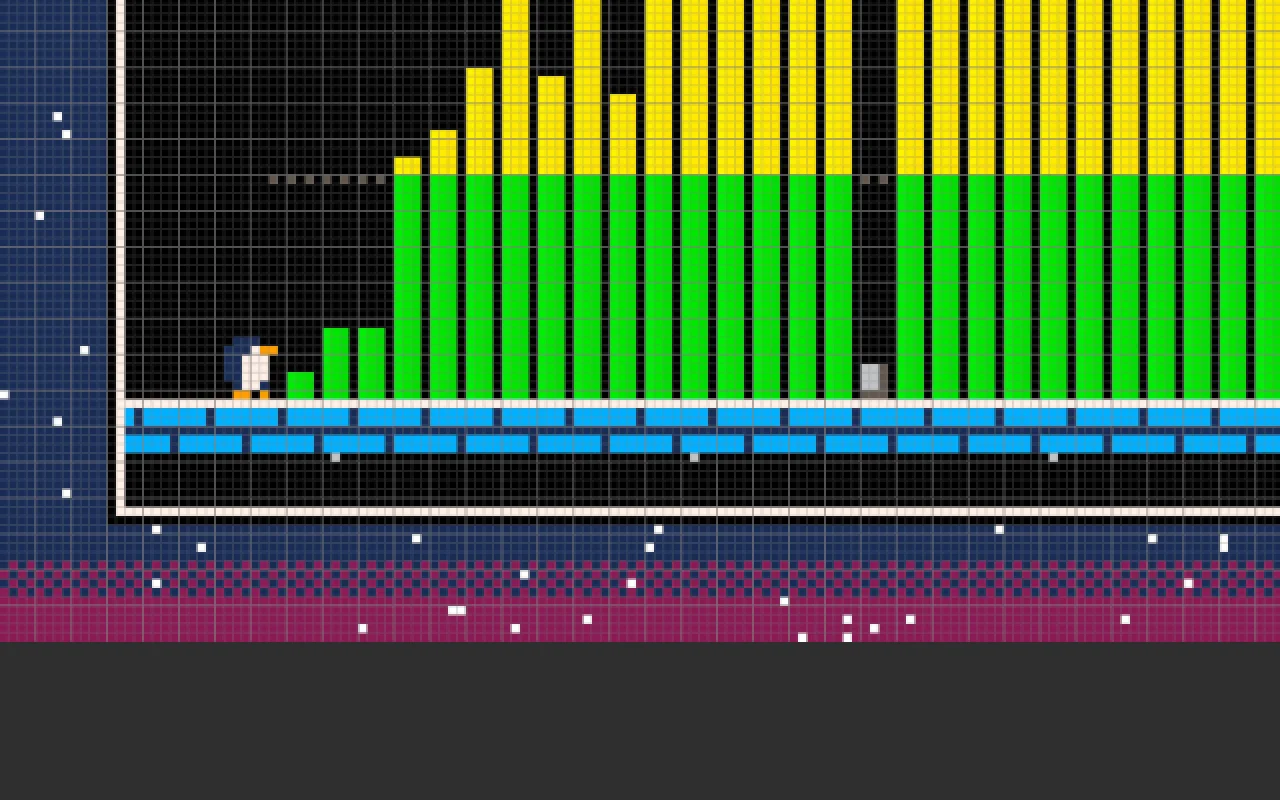
The player character stands at the start of the level, on the floor just left of 1979. Add a layer named
Penguin. It's 6 cells wide and 7 tall, with its top-left corner at200, 1008, so its feet touch the snow at1064.Here's the sprite, row by row from the top.
Nis navy ,Wis snow,Ois orange and.is empty:.NNN..NNNWOONNWWW.NNWWW.NNWWW..NWWN..OO.O.
Draw one colour at a time: Shift-select all of its cells, then fill. The single snow cell in row 2 is the eye.
The penguin faces right, toward the data.
-
Mark the story points
Add each of these on its own layer inside
Sprites:- Protocol Marker. A dotted leader in sky blue: Shift-select one cell every 16 px at
520, from432down to600. Fill it. It runs from the dialog box down to the top of the 1987 bar. - Callout. A dialog box from
296, 336to744, 424. Fill it black, then make a one-cell ring inside its edge (select it, Alt-drag one cell in) and fill the ring sky blue. - Crown. On the 2000 record bar, a crown 5 cells wide starting at
920, 432. The top row is cells 1, 3 and 5, with two full rows under it. Fill it yellow. It sits one cell above the bar, clear of the 30 line. - Low Arrow. Over 2019's dip, a down arrow 5 cells wide at
1528, 688. The rows are.XXX.,.XXX.,XXXXX,.XXX.,..X... Add a dotted leader above it at1544, from552to680. Fill both green. Green means good news here.
Collapse
Sprites.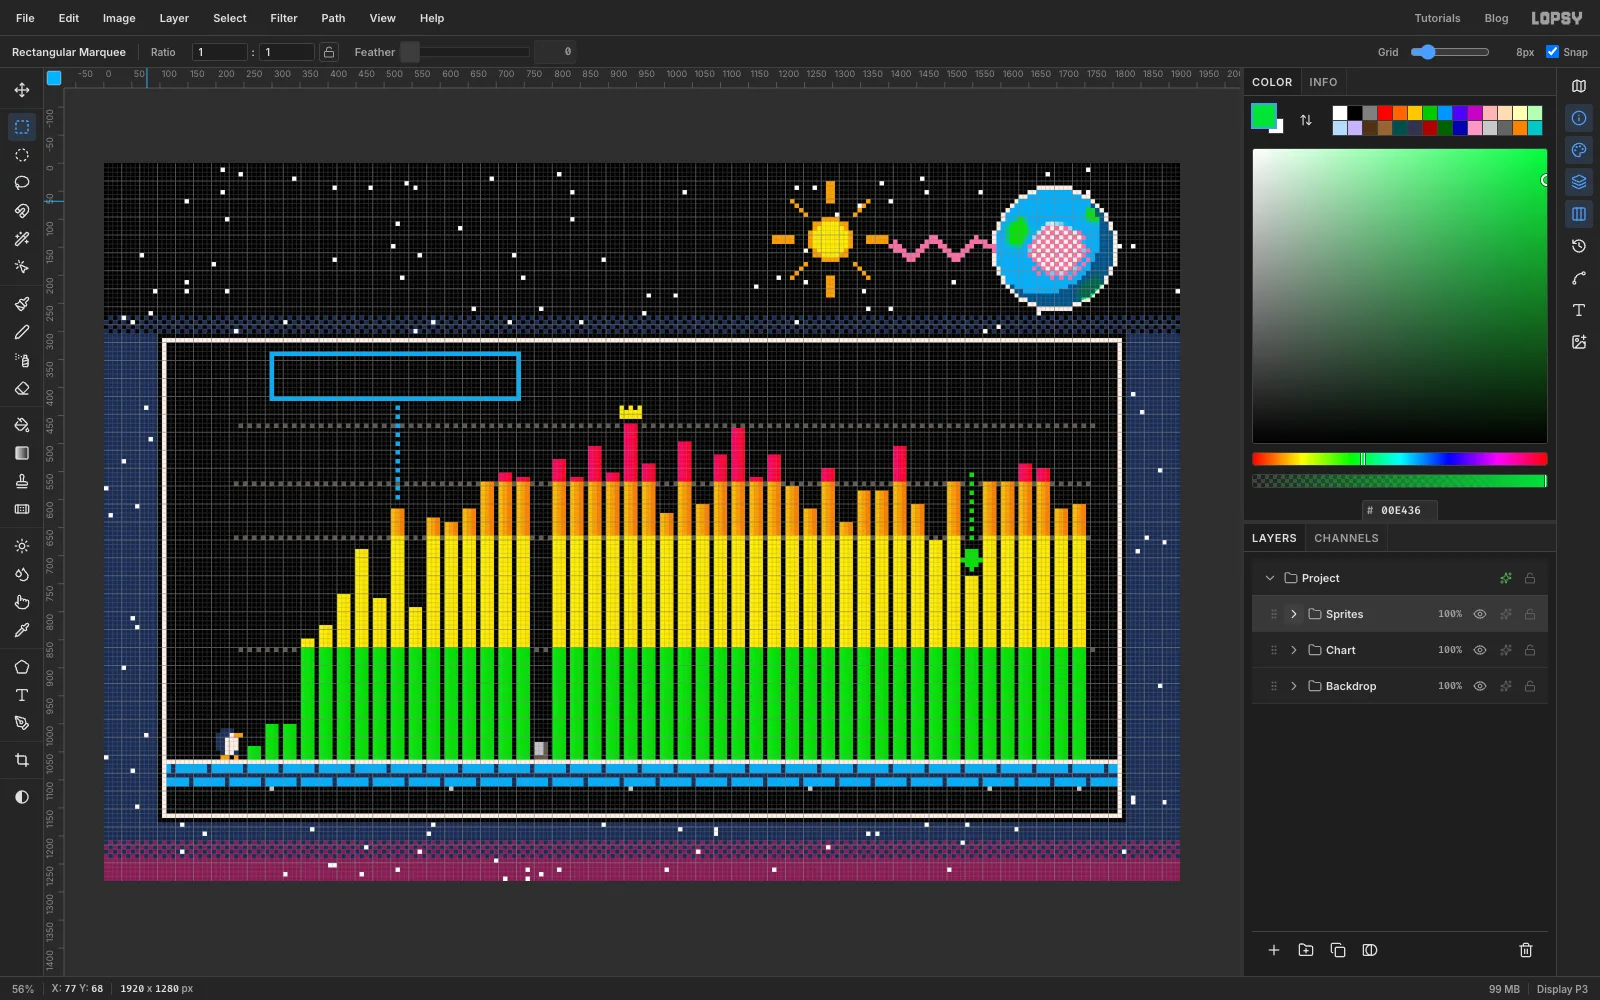
- Protocol Marker. A dotted leader in sky blue: Shift-select one cell every 16 px at
-
Set the title in Press Start 2P
Select
Sprites, click New Group and name itType. Turn Snap off for all the type steps, so the arrow keys nudge 1 px at a time.Inside
Type, add a layer namedLegend. Draw four 16 px squares in a row at the top right of the window, with their tops at344, in the four band colours. They start at x1384,1476,1592and1708, which leaves room for each label and ends the row at1768.Create text from the bottom up, so a click never lands on an existing line. Click the Legend layer before each new text: if a text layer is selected, changing the font restyles that layer instead.
- Text tool, Silkscreen, Size
24, sky blue. Click at the left margin about240down and typeBIGGEST DAILY HOLE EACH YEAR, IN MILLION SQ KM. Its letters should start at y240. - Silkscreen
32in snow:THE ANTARCTIC OZONE HOLE, 1979-2025, with its top at192. - Press Start 2P
88in yellow:OZONE ZONE, with its top at64.
Lopsy names each text layer after its text. Rename them (
Units,Subtitle,Titleand so on) to keep the panel readable.Line up each line's left edge with the window's left edge at
96, using the arrow keys with the Move tool. Then give the title a Drop Shadow: colour red , Offset X and Y8, Blur0, Opacity100. One hard cell of shadow, like an arcade marquee.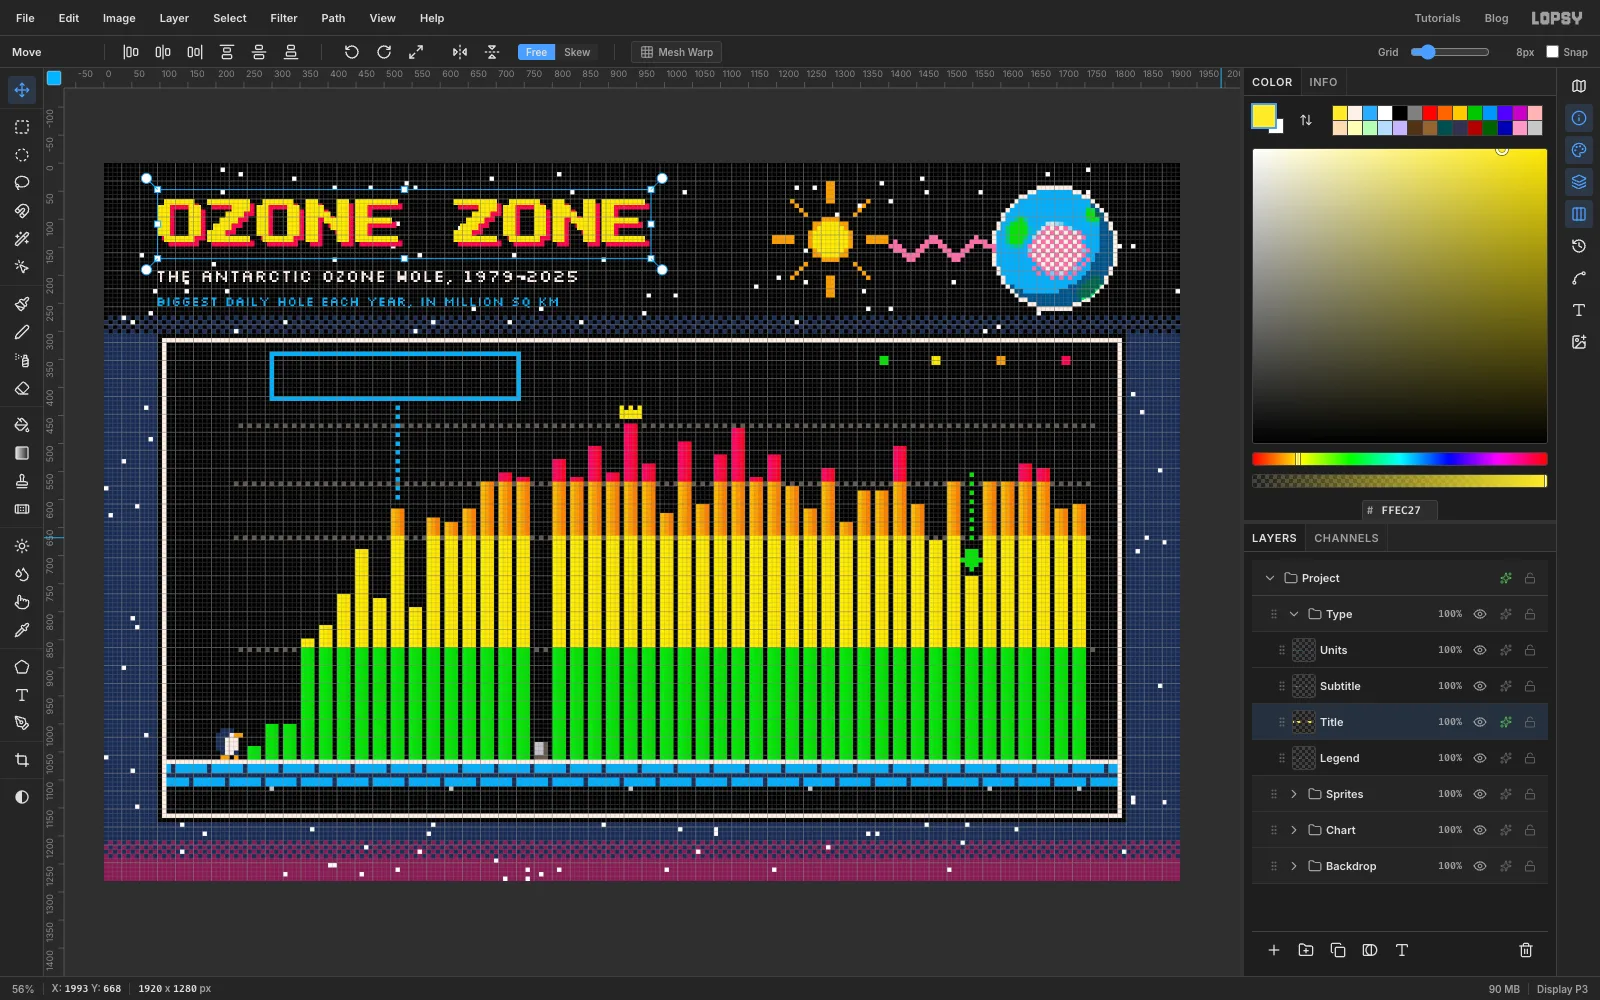
- Text tool, Silkscreen, Size
-
Clear the stars off the type
A star touching a letter reads as punctuation. "SQ KM" can turn into "SQ.KM". Expand
Backdropand selectStars. Draw a marquee over the title block, then Shift-add rectangles over the subtitle lines, the sun-and-Earth area, and the strip under the window where the source line will go. Press Delete, deselect and collapseBackdrop.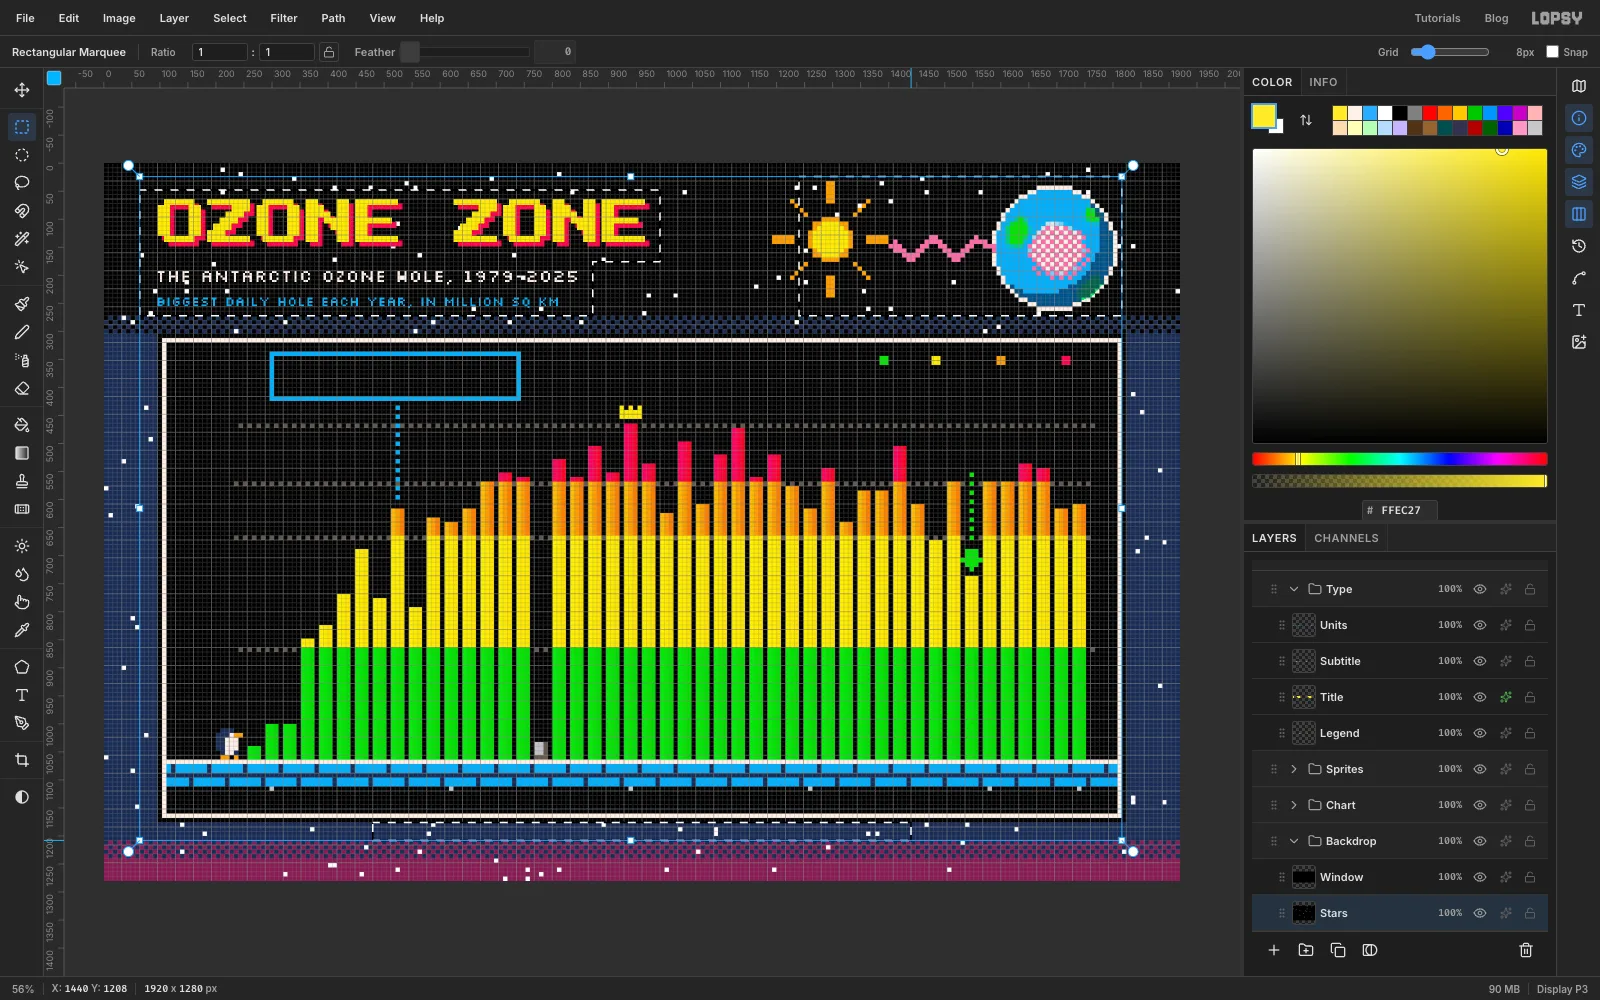
-
Label the chart
Everything inside the window is Press Start 2P, at size
16unless noted. Every letter is exactly as wide as the font size, which makes spacing easy to work out. Centre each label on whatever it describes, nudging it into place with the arrow keys.- The dialog box,
16px. WriteCFC PHASE-OUT BEGINSin sky blue, and above it1987 MONTREAL PROTOCOLin snow. Centre both on the box (x520), with the same space above and below the pair. NEXT LEVEL: FULL RECOVERY ~2066in pink, under the legend, with its right edge at1768, where the gridlines end. Make the legend labels (<10,10-20,20-25,25+) at size12in silver, each one cell after its square, ending at the same edge.HI-SCORE 29.9in yellow over the crown,LOW 16.4in green over its leader, and1979: 1.1in green over the first bar.- Two lines over the 2025 bar:
NOWand22.9in snow, centred on the bar. - Axis numbers
10,20,25and30in silver, right-aligned at208and centred on their gridlines, plusMILLION SQ KMat size12above the 30. - The years in one line:
1980, 16 spaces,1990, 16 spaces,2000, 16 spaces,2010, 16 spaces,2020, 6 spaces,2025. Start it at268under the floor. Because every character is 16 px, each year lands centred over its tick. - A black
?centred on the grey block, and the source line centred under the window in snow at size12:SOURCE: NASA OZONE WATCH / ? = NO DATA FOR 1995.
Size
12is a compromise. It fits in tight spots but doesn't fall on whole font pixels, so keep it to these small notes.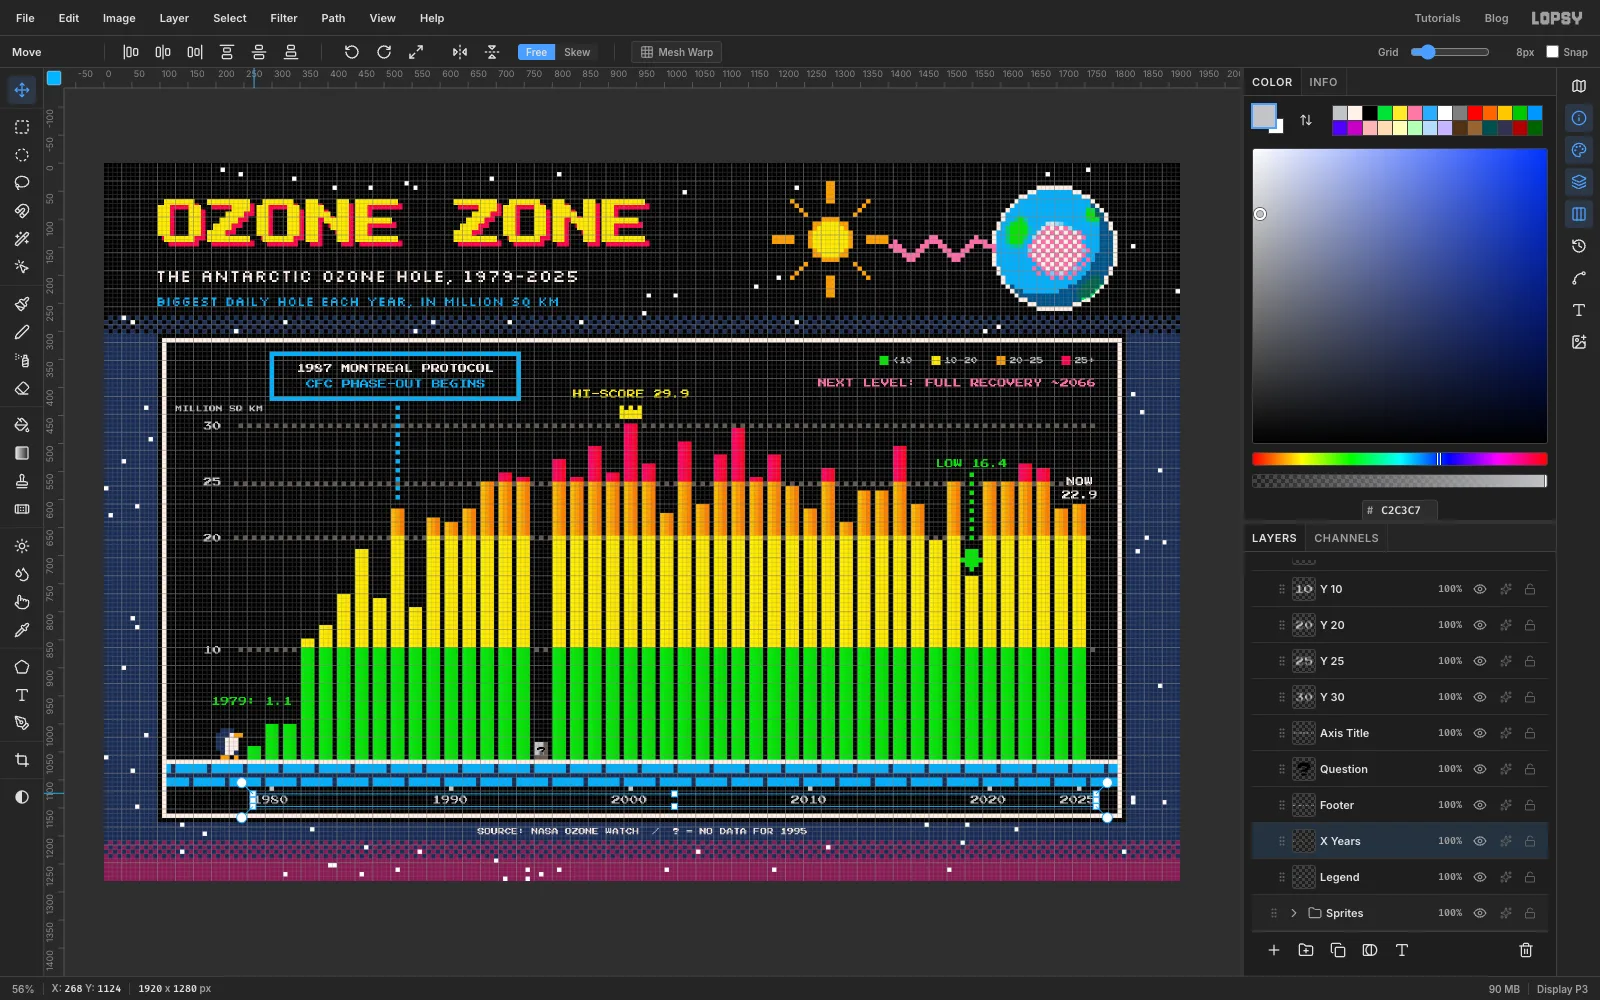
- The dialog box,
-
Knock out the gridline behind NOW
The 25 line runs right through
NOW. ExpandChart, selectGridlines, draw a marquee around the label and press Delete. Leaving a gap in a gridline for a label is normal practice in data viz.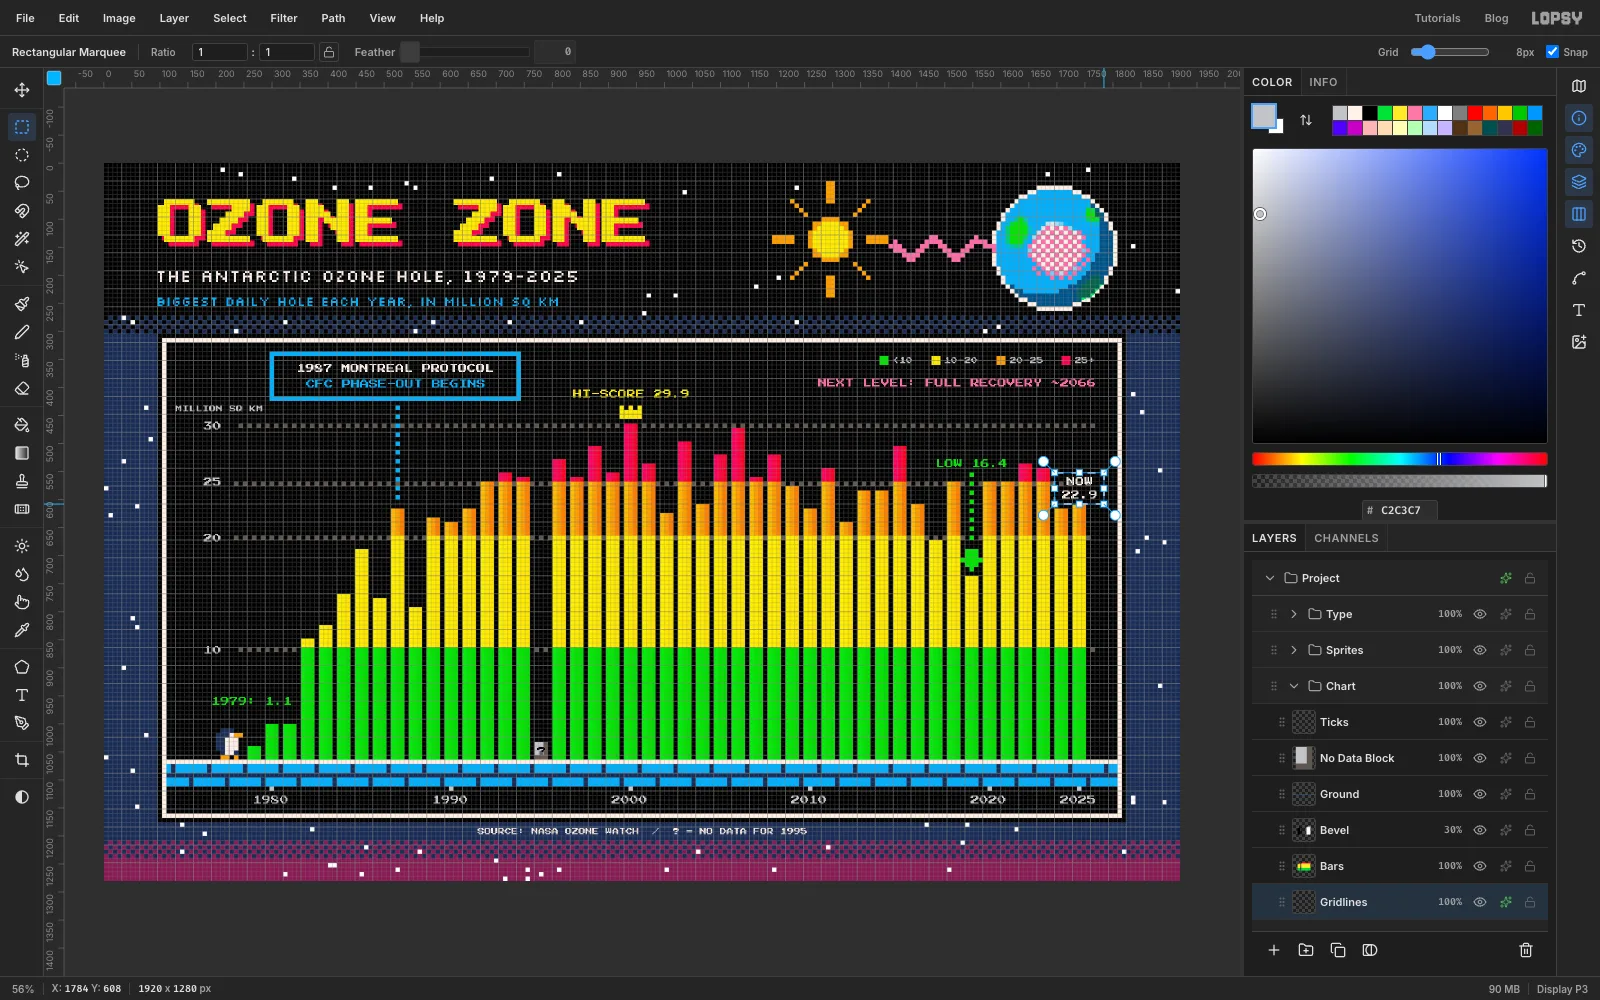
-
Finish with soft scanlines
Last, a nod to the CRT television these games ran on.
- Select
Type, click New Group and name itCRT. Add a layer namedScanlines. - With Snap off, fill a 2 px strip black at the bottom of an 8 × 8 tile in the top-left corner (
0, 6to8, 8). Select the 8 × 8 square and Define Pattern, then delete the tile. - Select → All and fill with the new pattern.
- Set the layer to Multiply at
12%.
Every pixel row now has a slightly darker bottom edge, like a TV's scanlines. At 12% the colours barely shift. A heavier setting, or a smooth radial vignette, would wash the whole poster in in-between colours, and it would stop looking 8-bit.
Turn off the grid with View → Show Grid, save the project with File → Save Project and export with File → Quick Export PNG.
- Select