Make a Psychedelic Data Visualization Poster of Daylight
Chart a year of daylight from the Equator to the North Pole as a 1960s psychedelic poster in Lopsy, with a Gradient Map, Liquify swirls and text on paths.
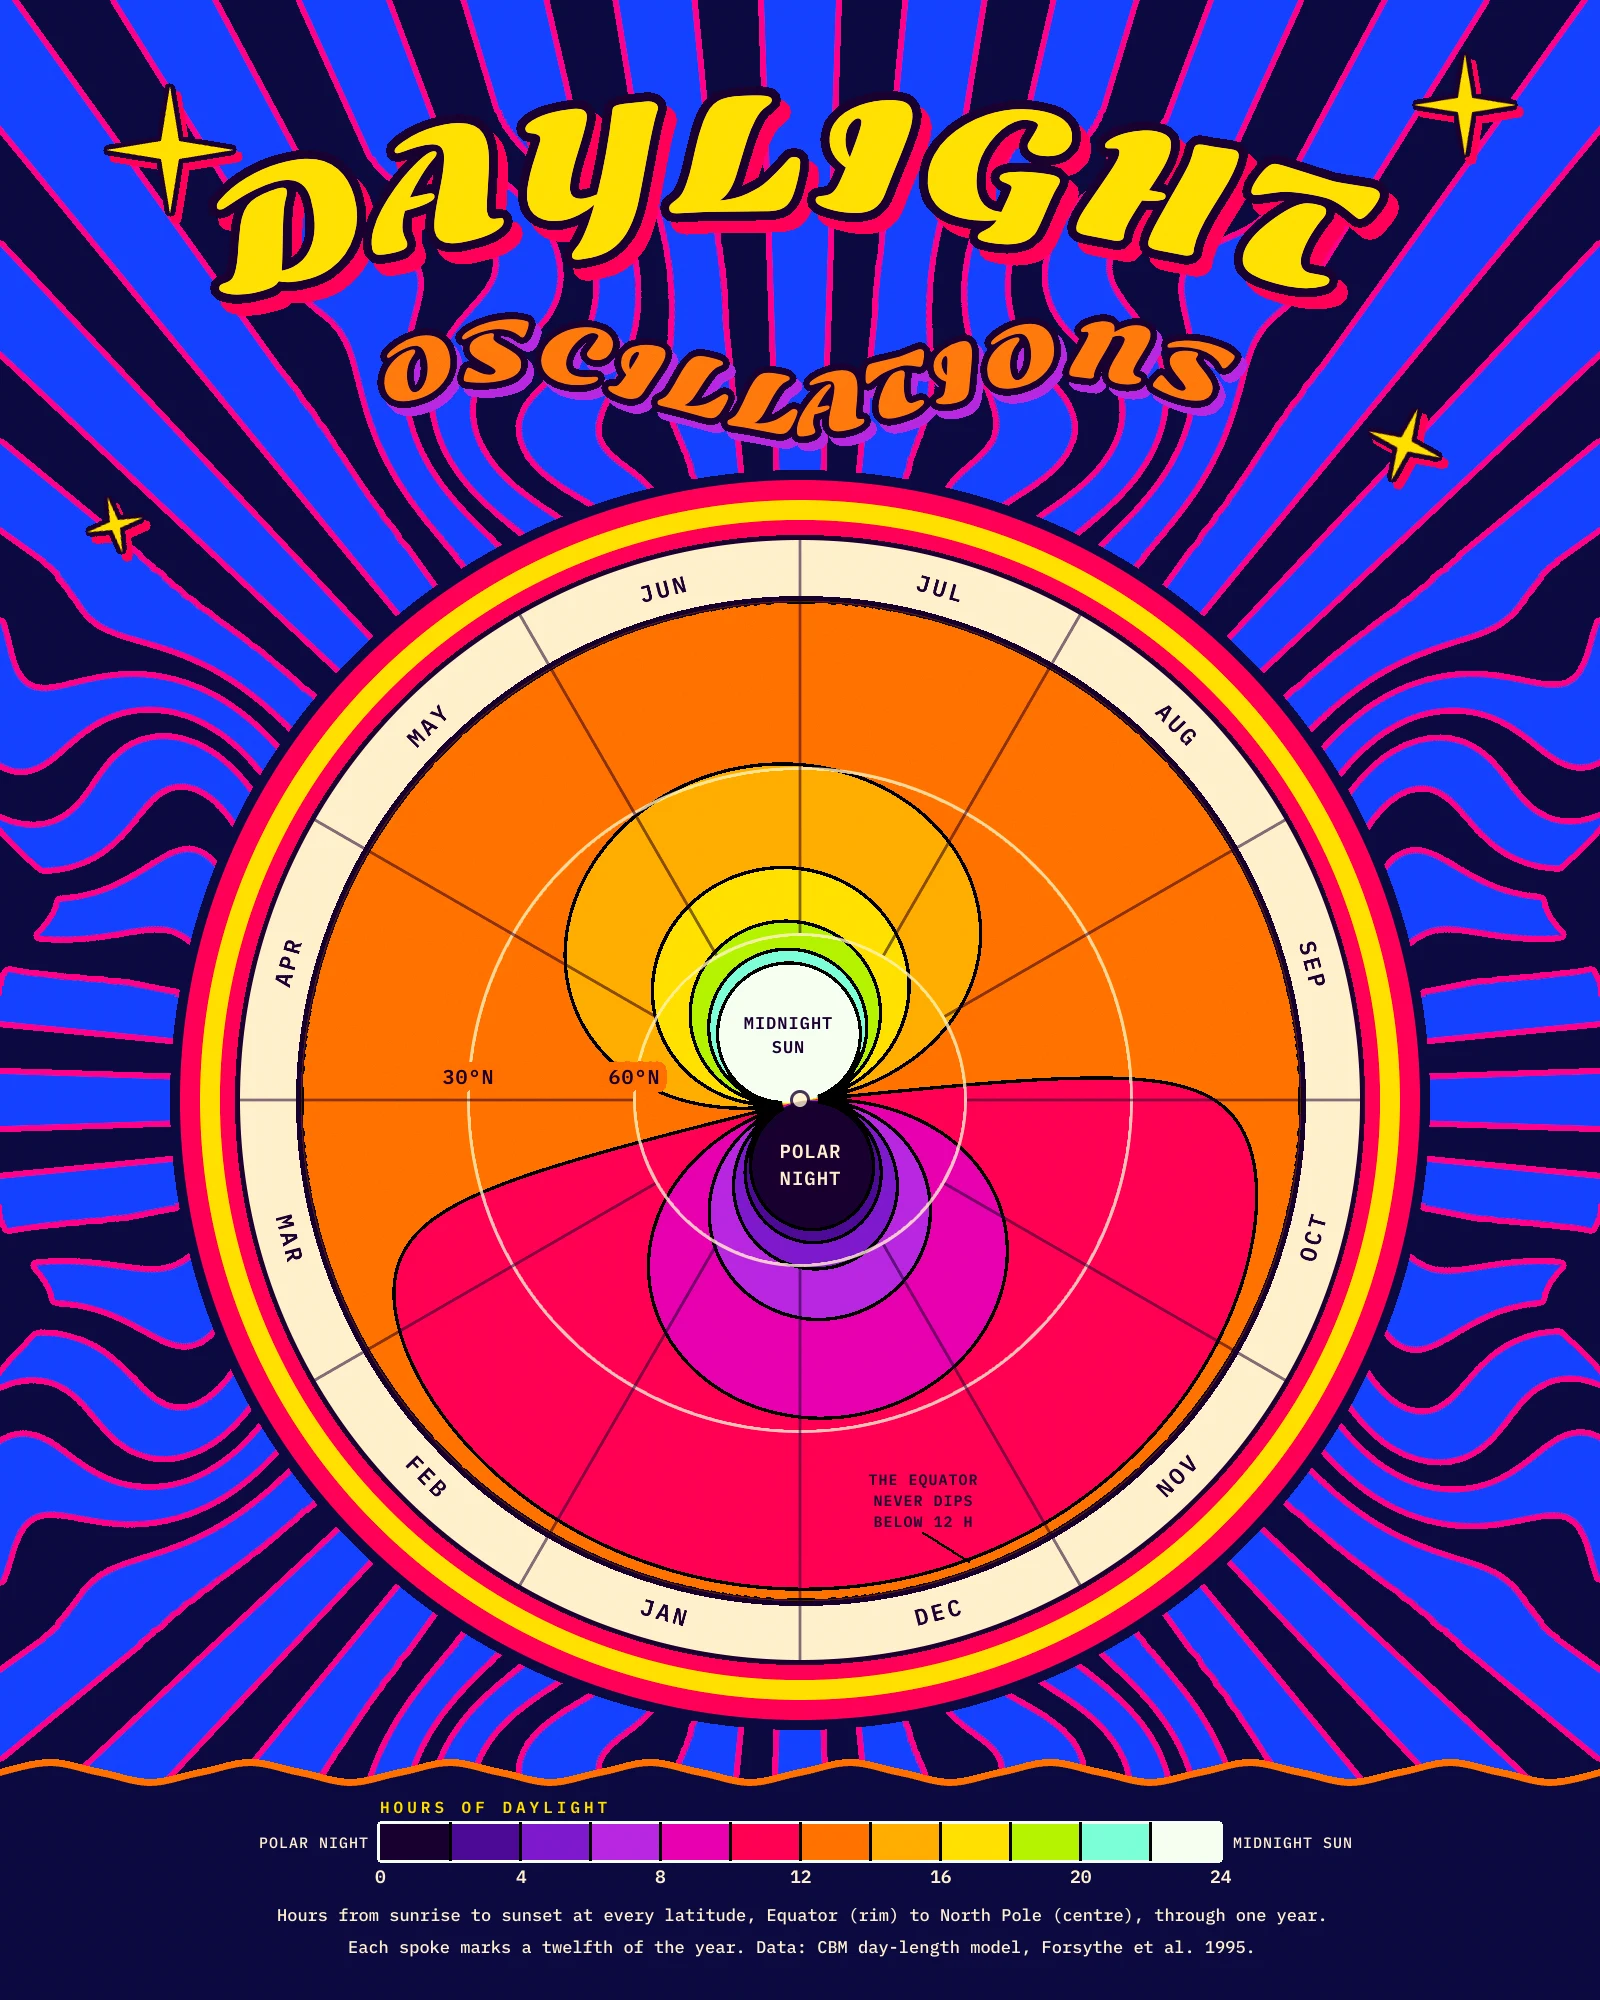
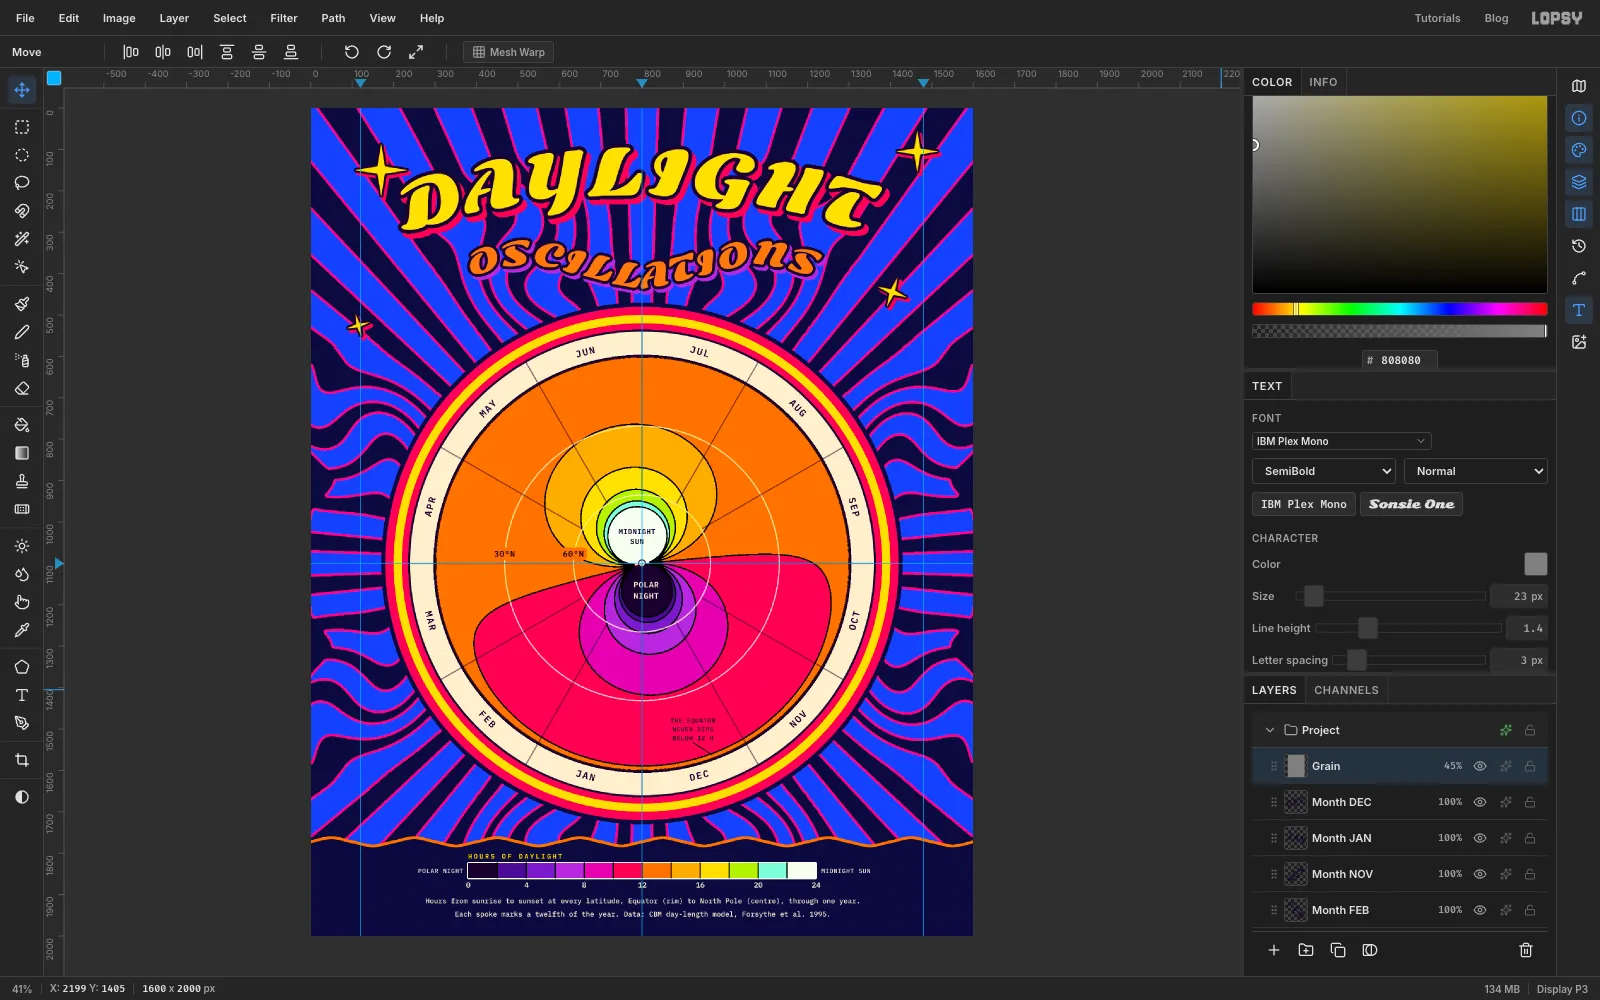
On the Equator, the sun is up for about twelve hours every day of the year. At the North Pole it's up for half the year and down for the other half. Everywhere in between swings back and forth, and the swing grows the further north you go. In this tutorial you'll turn those swings into Daylight Oscillations, a 1600 × 2000 px poster in the style of the 1960s San Francisco concert posters: wavy lettering, swirling rays, and colours that vibrate against each other.
It's also a real chart, so a few things are fixed:
- The centre is the North Pole and the rim is the Equator. Distance from the centre is the distance from the Pole, so the 60°N circle is a third of the way out and the 30°N circle is two thirds of the way out.
- The angle is the day of the year. January 1 points straight down, and the year runs clockwise, up the left side through spring, across the top in summer and down the right side in autumn.
- The colour is the hours of daylight, in twelve classes of two hours each: 0–2 h, 2–4 h and so on up to 22–24 h.
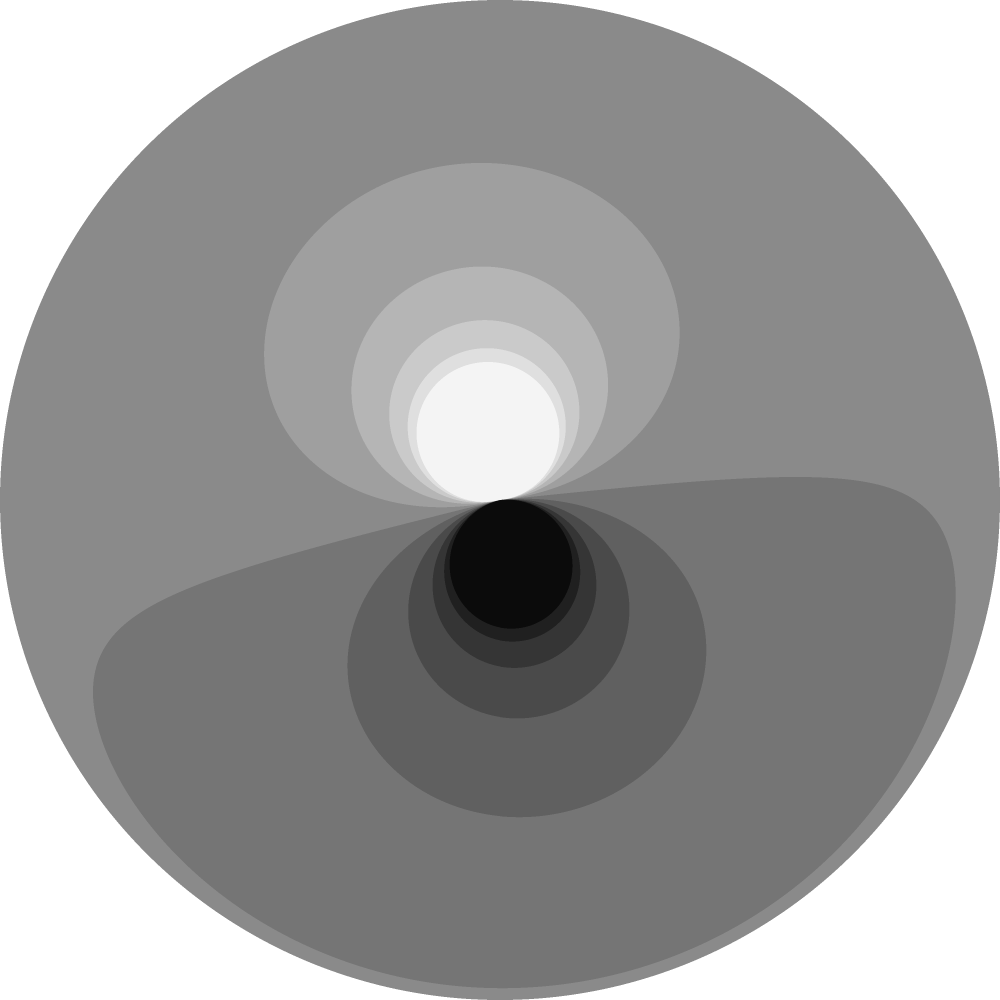
You don't have to compute the chart yourself. The step Get the data disc below has a 1000 × 1000 px grey disc for you to save made from the CBM day-length model (Forsythe and others, 1995). Each two-hour class is painted in one flat grey, from for 0–2 h up to for 22–24 h, in twelve even steps. You'll colour it inside Lopsy with a Gradient Map, so every class gets exactly one colour. If you want to chart something else, any grey image with flat steps works the same way.
Along the way you'll use:
- guides, the marquees' exact-corners dialog, Edit → Fill and Select → Shrink
- Sunburst, Liquify (Twirl), Find Edges, Gaussian Blur, Threshold, Invert and Add Noise
- a group with a Gradient Map adjustment, and the Multiply and Overlay blend modes
- the Pen tool for a wavy panel edge, a sparkle and two text paths, plus Path to Selection in the Paths panel
- the Brush with Radial Symmetry, and the Pencil with Shift-click lines
- Stroke and Drop Shadow effects, and Merge Down
- copy and paste, scaling with Cmd-drag and rotating with the Move tool's rotate handle
- text in Sonsie One and IBM Plex Mono, set on paths and rotated
The palette:
-
Night
-
cobalt rays
-
ray outline
-
Daylight classes
-
Rim cream
-
ink
-
Set up the page and guides
Choose File → New, set the size to 1600 × 2000 px and click Create. The document starts with a white
Backgroundand an emptyLayer 1. You'll useLayer 1later, so leave it where it is.Click the
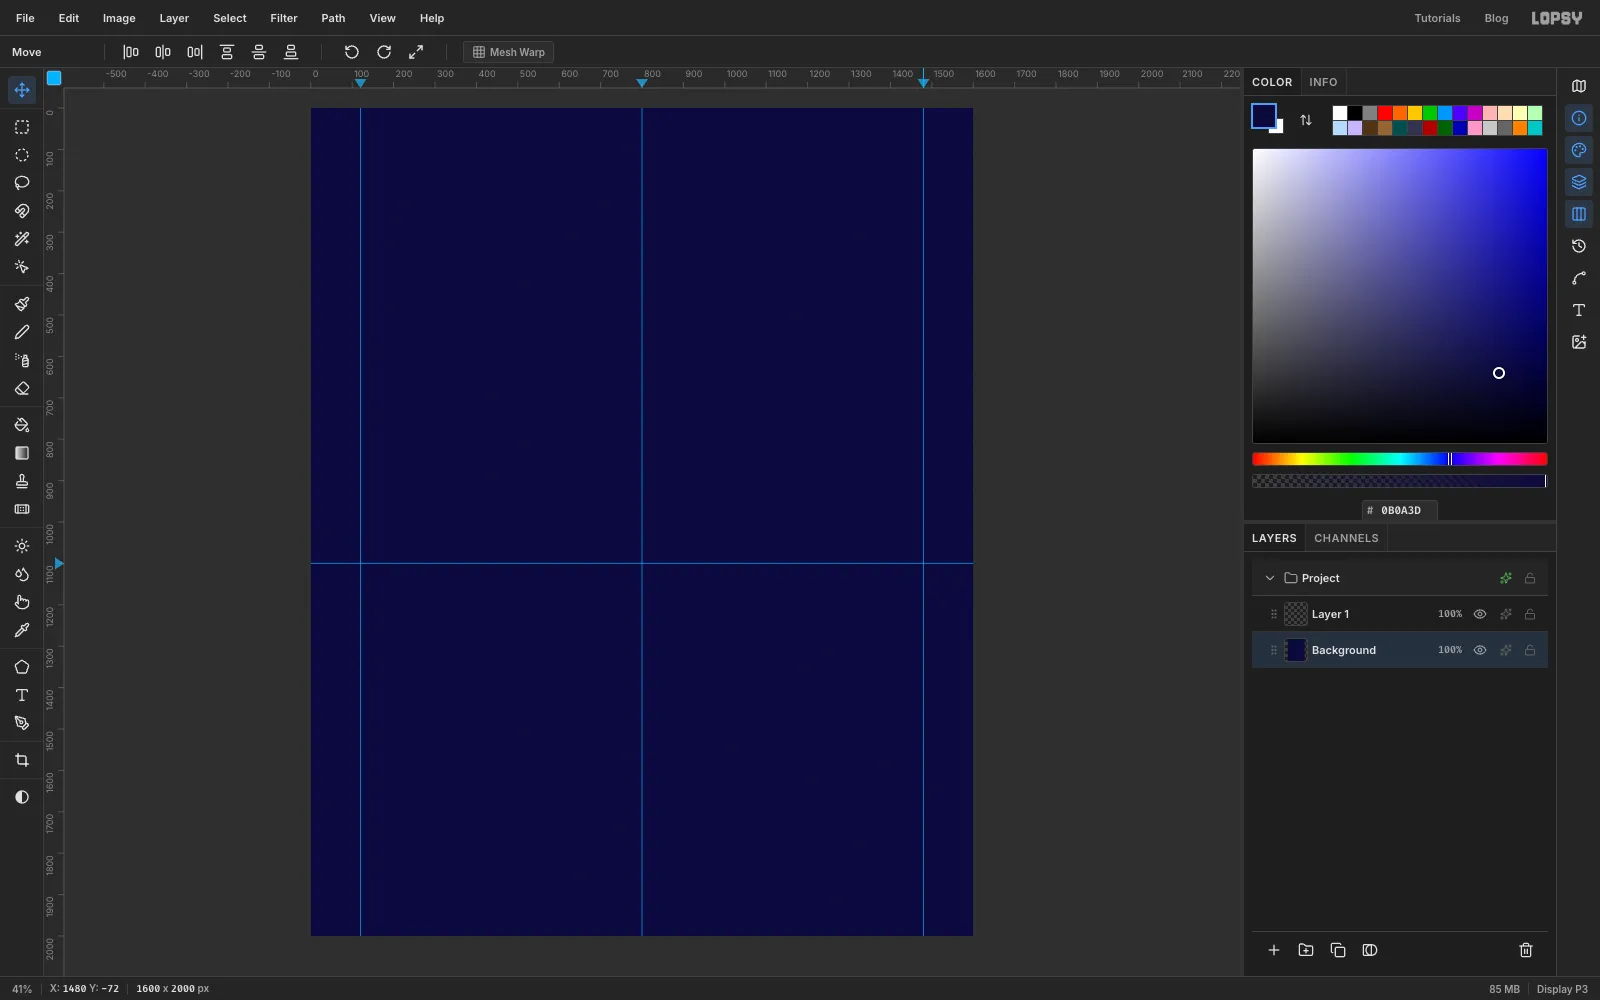
Backgroundrow in the Layers panel. Set the foreground colour to in the Color panel's hex field and choose Edit → Fill.Now drop four guides. Click the top ruler at 800 for the centre line, and at 120 and 1480 for the side margins. Click the left ruler at 1100. That horizontal guide runs through the Pole.
-
Paint the sunburst
Click Add Layer at the bottom of the Layers panel and double-click the new layer's name to rename it
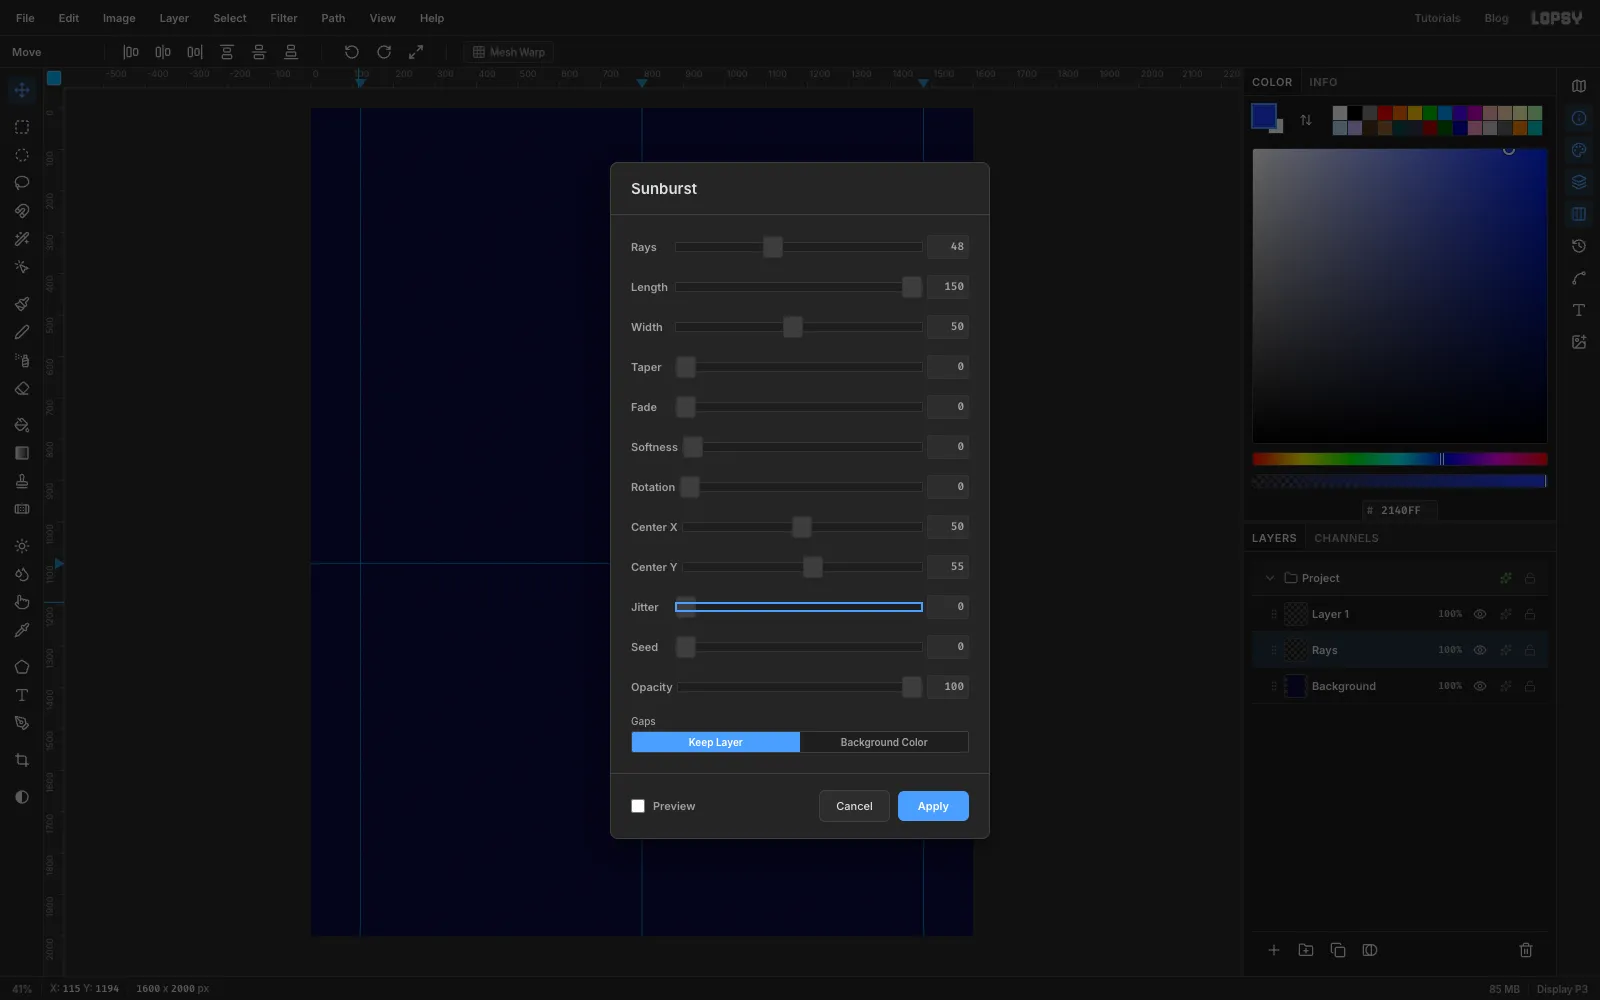
Rays. Set the foreground to .Choose Filter → Sunburst…. Sunburst paints in the foreground colour. Set these values and leave everything else at its default:
- Rays
48 - Length
150, so the rays reach every corner - Width
50 - Center Y
55. The burst then starts 55% of the way down the page, which is the Pole at y 1100.
Click Apply. You now have cobalt rays on night blue, all pointing at the Pole.
- Rays
-
Twist the rays into eddies with Liquify
With
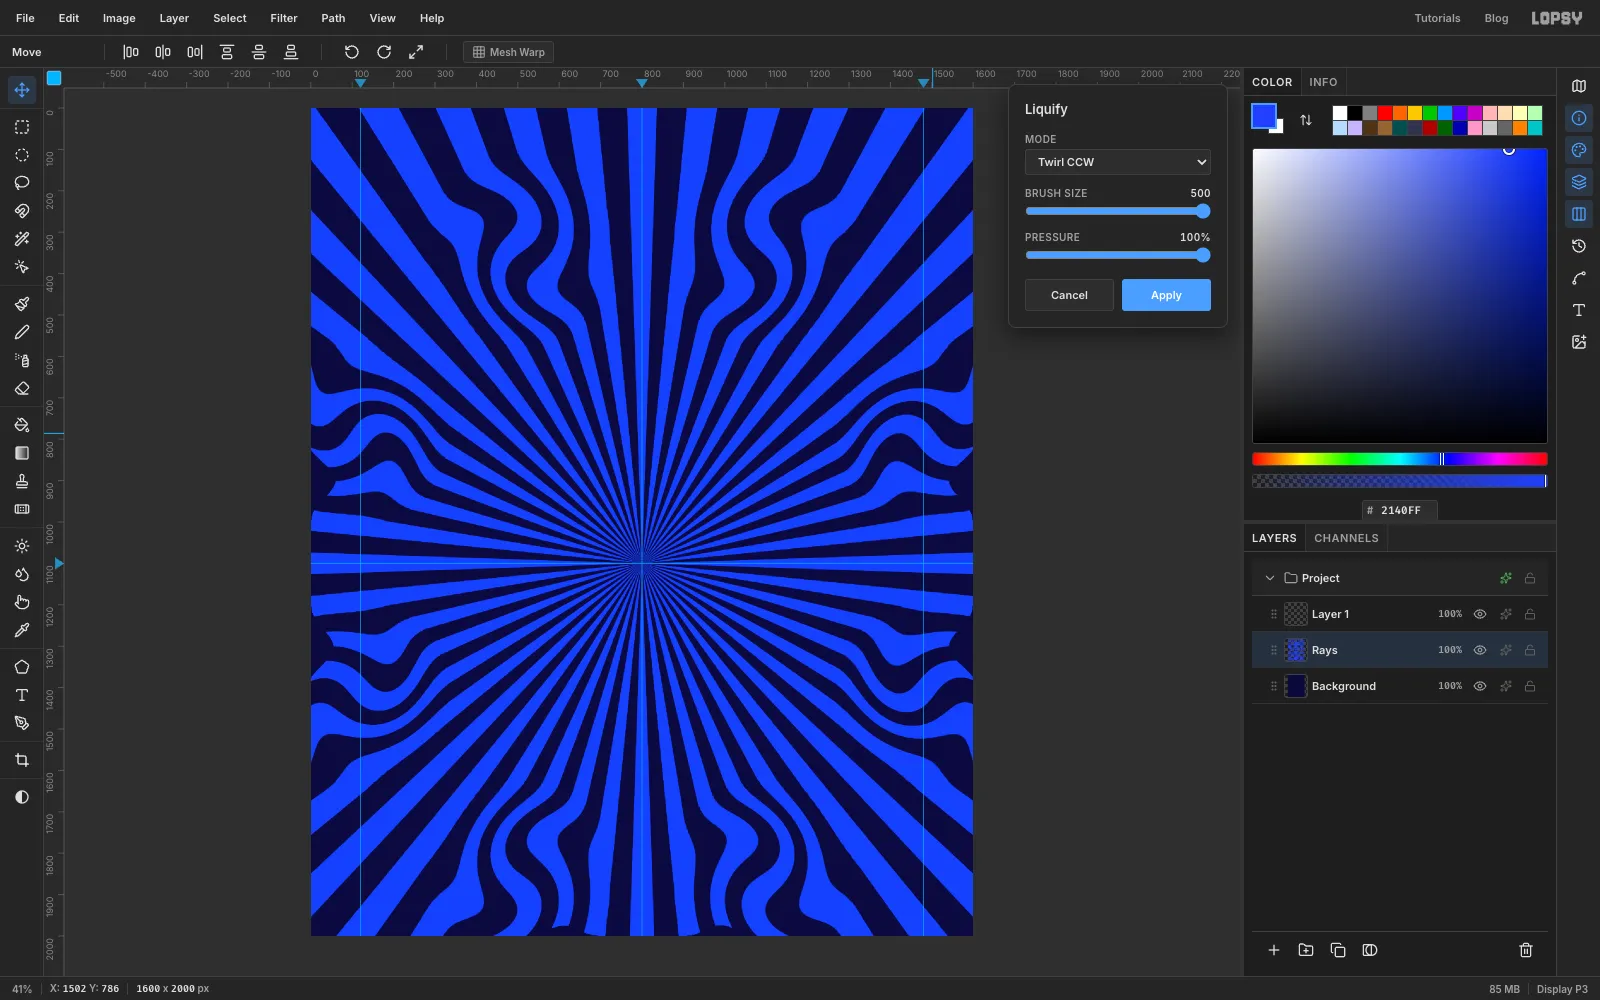
Raysstill selected, choose Filter → Liquify…. Set Mode to Twirl CW, Brush Size to500and Pressure to100.You'll make eight eddies, evenly spaced round an oval just outside where the chart will go. The odd ones twist clockwise and the even ones anticlockwise. Twirl only works while the pointer is moving, so at each point press the mouse button and wiggle it in tiny circles on the spot for under a second, then let go.
With Twirl CW, twist at the four points that start at lower right and go round clockwise: about 1500, 1415 (right, low), 510, 1860 (bottom left), 100, 785 (left, high) and 1090, 340 (top right). Click Apply.
Open Filter → Liquify… again and set Mode to Twirl CCW, with the same size and pressure. Twist at the four points in between: 1090, 1860, 100, 1415, 510, 340 and 1500, 785. Click Apply.
Alternating the direction makes each eddy turn against its neighbours. That's what gives the background its paisley, poured-paint look.
-
Add the halo rings
Click Add Layer and name it
Halo. You'll fill three circles, biggest first, each one on top of the last.Press Cmd+D so nothing is selected, pick the Elliptical Marquee and click once on the canvas without dragging. The exact-corners dialog opens. Type the corners of each circle, press Enter, set the colour and choose Edit → Fill:
- From 180, 480 to 1420, 1720, filled with
- From 200, 500 to 1400, 1700, filled with
- From 220, 520 to 1380, 1680, filled with
Before each new circle, press Cmd+D and click once again. The dialog only opens when nothing is selected.
Press Cmd+D. Click the ✦ button on the
Halorow to open the effects drawer. Tick Stroke and set Width to10, the colour to and the position to outside. That gives you a hard night-blue gap between the rings and the rays. Close the drawer.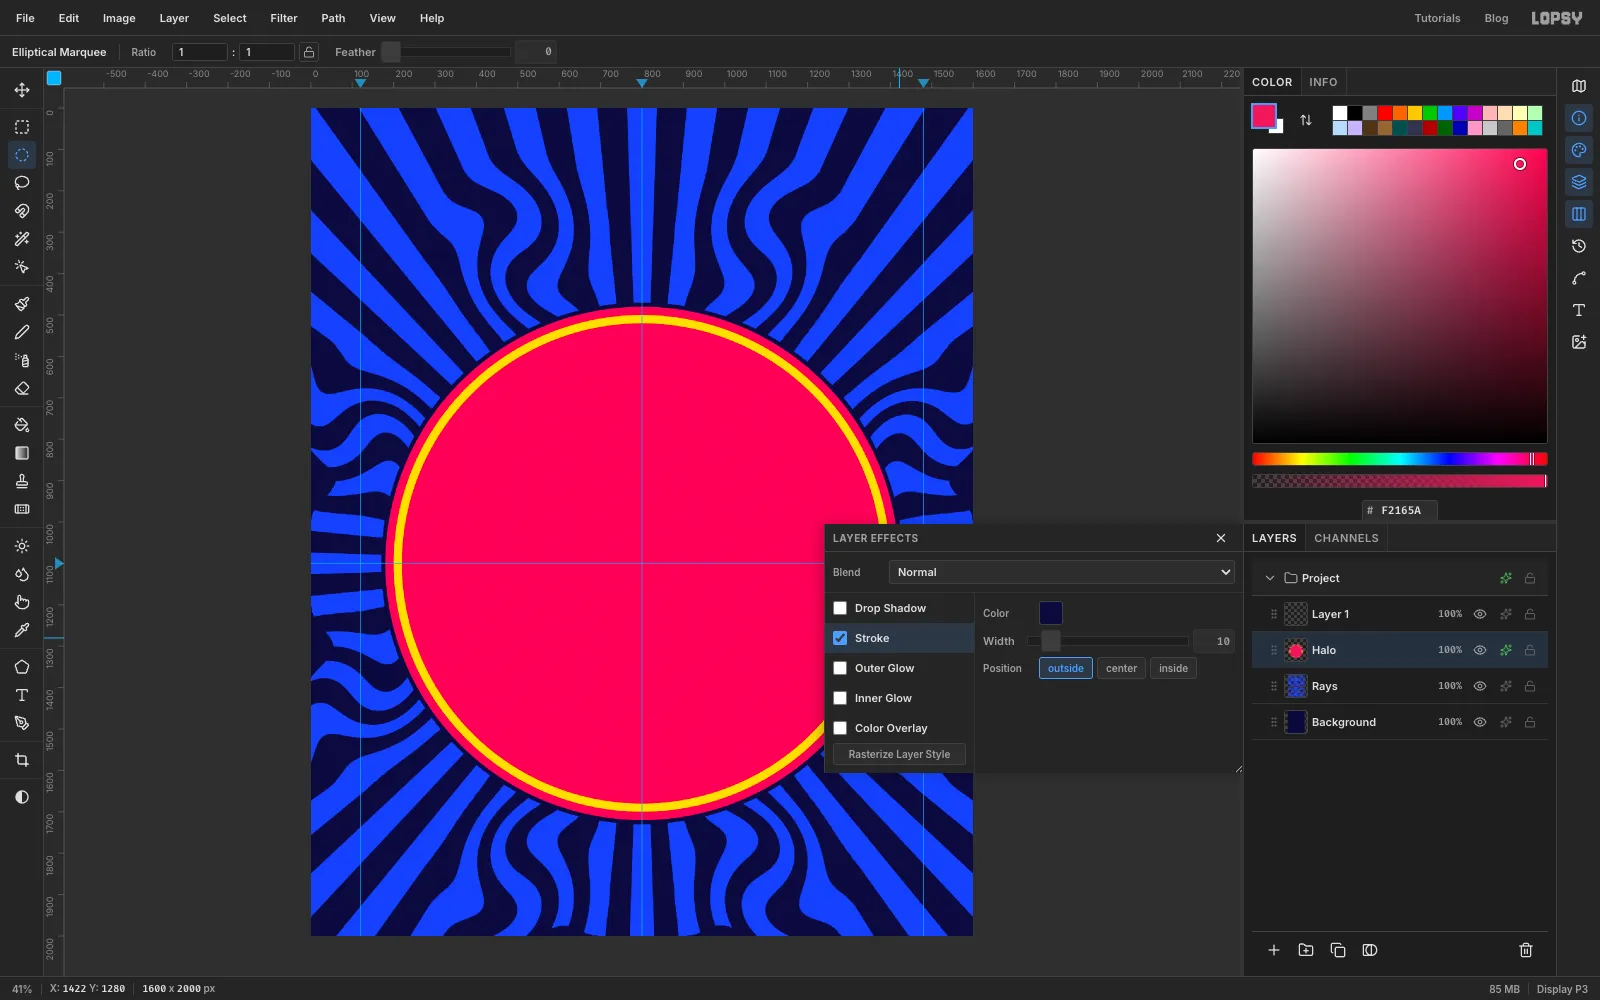
-
Draw the wavy footer panel with the Pen
Click Add Layer and name it
Footer Panel. The bottom of the poster is a night-blue panel with a wavy top edge, drawn with the Pen tool (P).- Click just off the canvas, below and left of the bottom-left corner, at about −12, 2012.
- Click just off the left edge at −12, 1776.
- Now drag out smooth anchors across the page. Start at 0, 1776 and place one every 50 px, dragging each about 17 px to the right as you place it. The heights repeat in this order: 1776, crest 1766, 1776, trough 1786. That's 33 anchors and eight gentle waves, each 200 px long, ending at 1600, 1776.
- Click off the right edge at 1612, 1776, then below the bottom-right corner at 1612, 2012.
- Click the first anchor to close the path.
Open the Paths panel and click Path to Selection, then Delete Path. Set the foreground to and choose Edit → Fill. Press Cmd+D.
Open the effects drawer for
Footer Panel, tick Stroke and set Width to7and the colour to . The orange line follows the wave only. The panel's other edges are off the canvas, so their stroke never shows. That's why you started and ended the path outside it.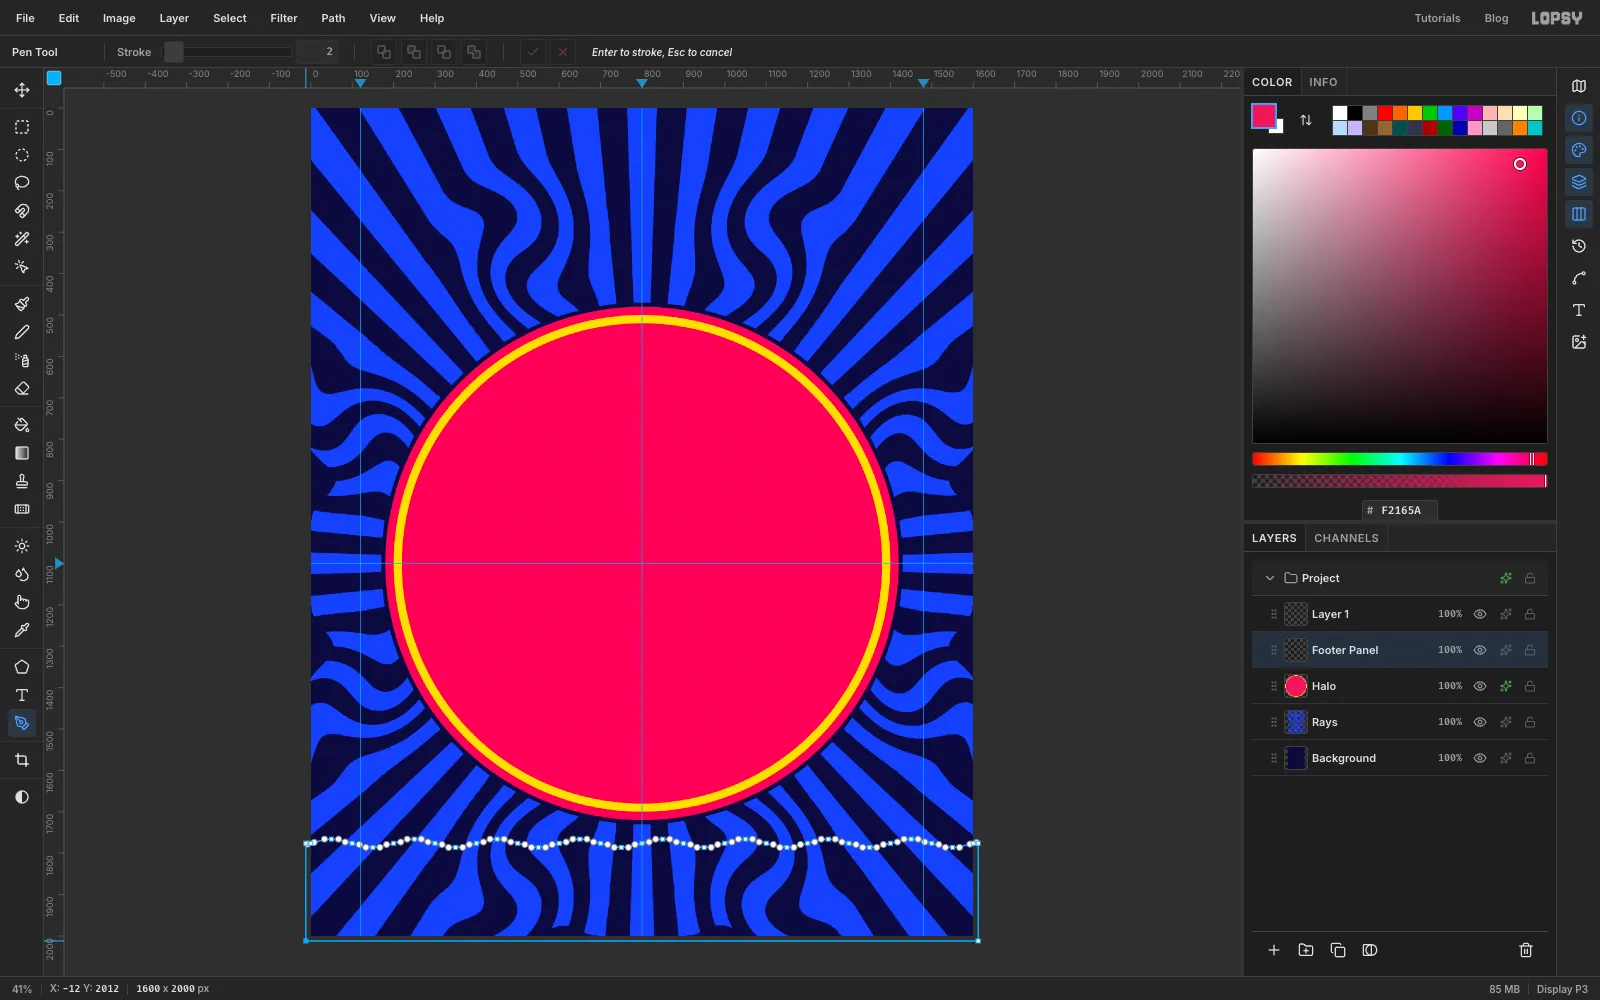
-
Lay down the cream rim
Click Add Layer and name it
Rim. Use the exact-corners dialog again for a circle from 240, 540 to 1360, 1660 (radius 560). Fill it with and press Cmd+D.Open the effects drawer and add a Stroke of Width
5in . Close the drawer. The data disc will cover the middle, so only a 60 px cream band will show, and that's where the month names go.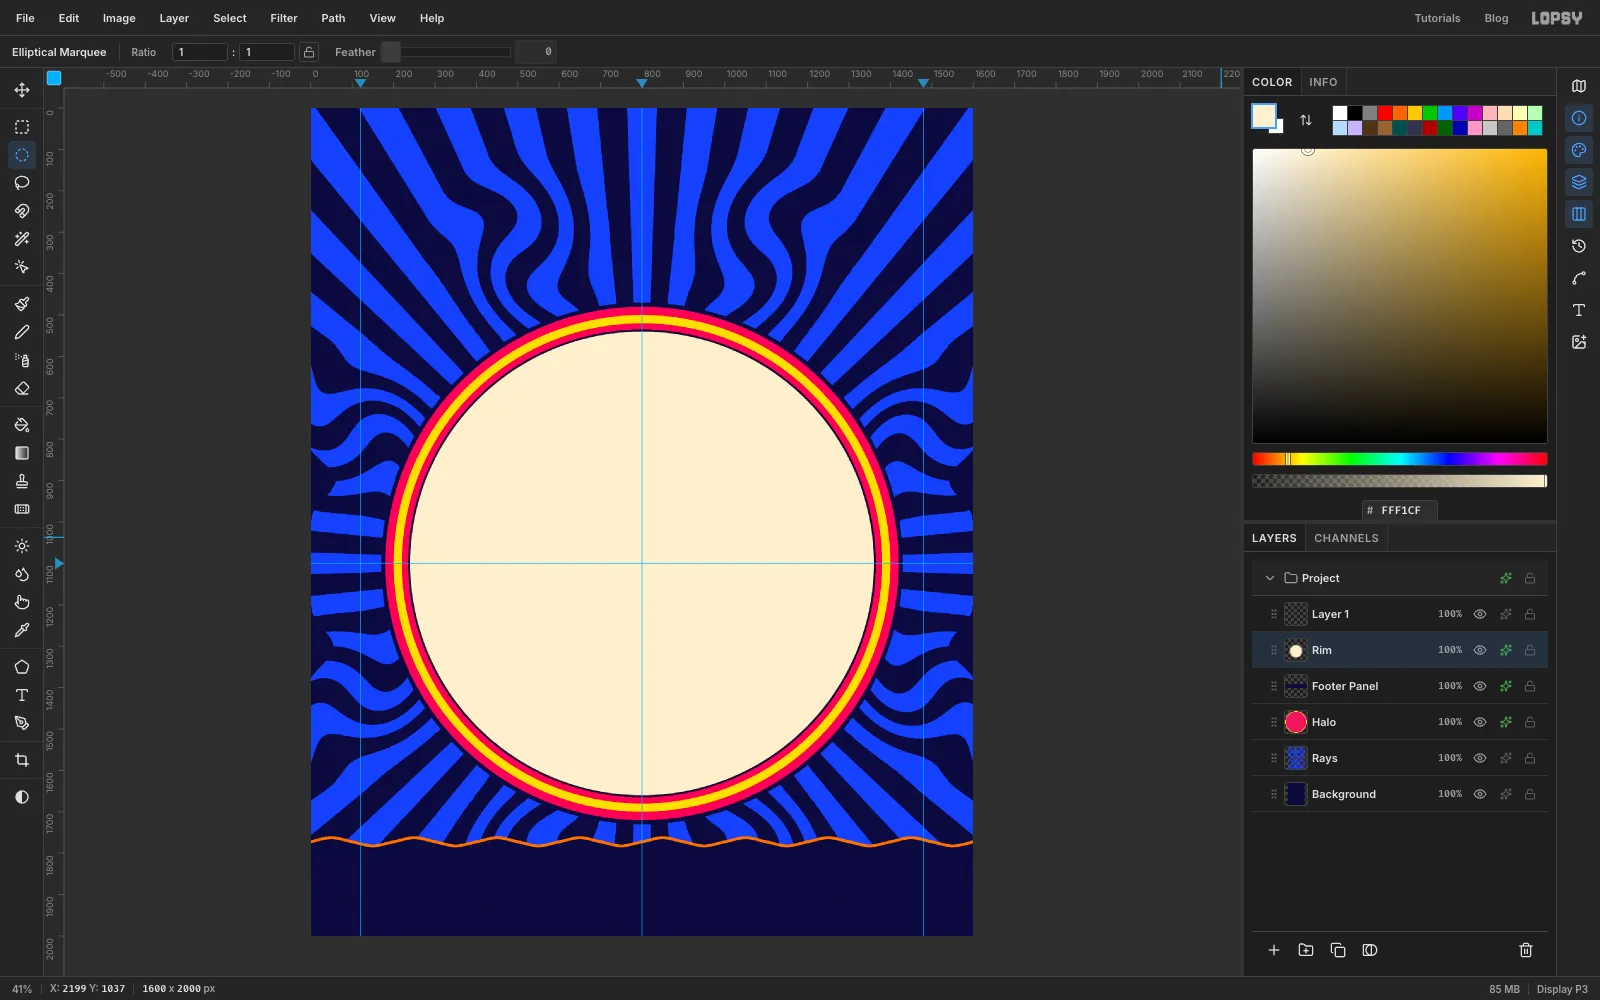
-
Get the data disc
This is the chart's data. Right-click the image above, choose Save Image As… and save it as
daylight-data-disc.png. It's exactly 1000 × 1000 px with a transparent background outside the circle.You can see the shape of the story already. The pale lobe above the centre is the long summer days near the Pole, and the dark lobe below it is the winter dark. Everything else is shades of 10 to 14 hours.
-
Drop in the data disc
With
Rimselected, click New Group at the bottom of the Layers panel and name the groupDaylight Data. Everything you put in this group will be coloured by one Gradient Map.Drag
daylight-data-disc.pngfrom your desktop onto the canvas. It arrives as a new layer inside the group, at the top-left corner, with its transform box showing. Rename itData Disc.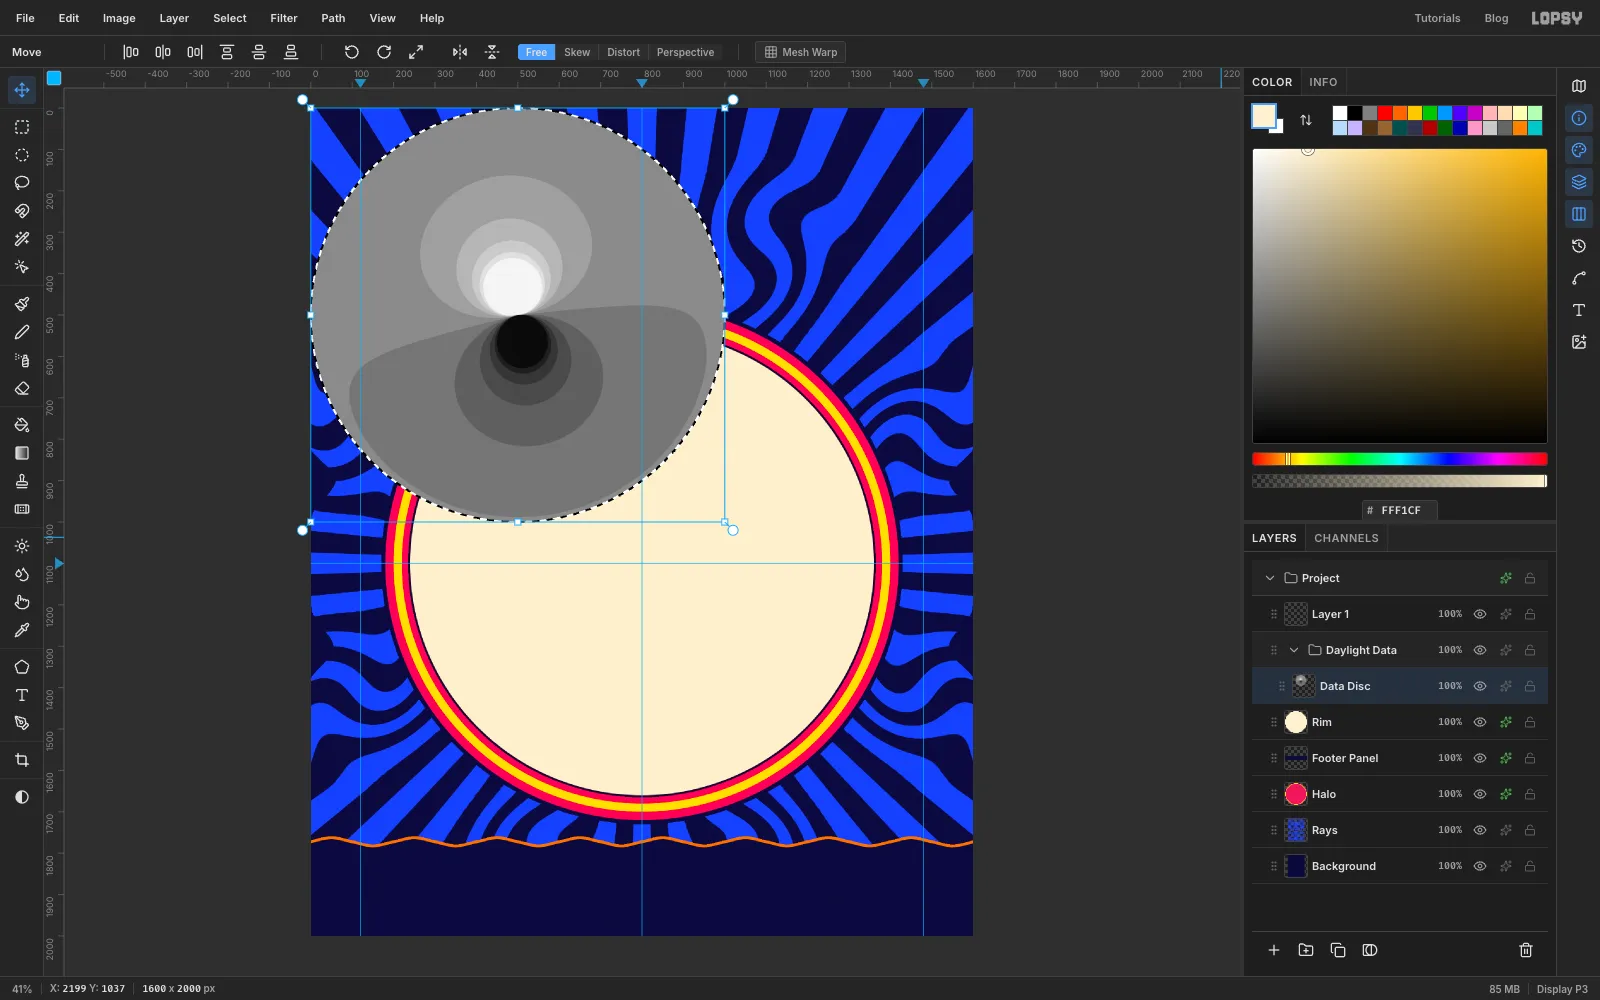
-
Centre the disc on the Pole
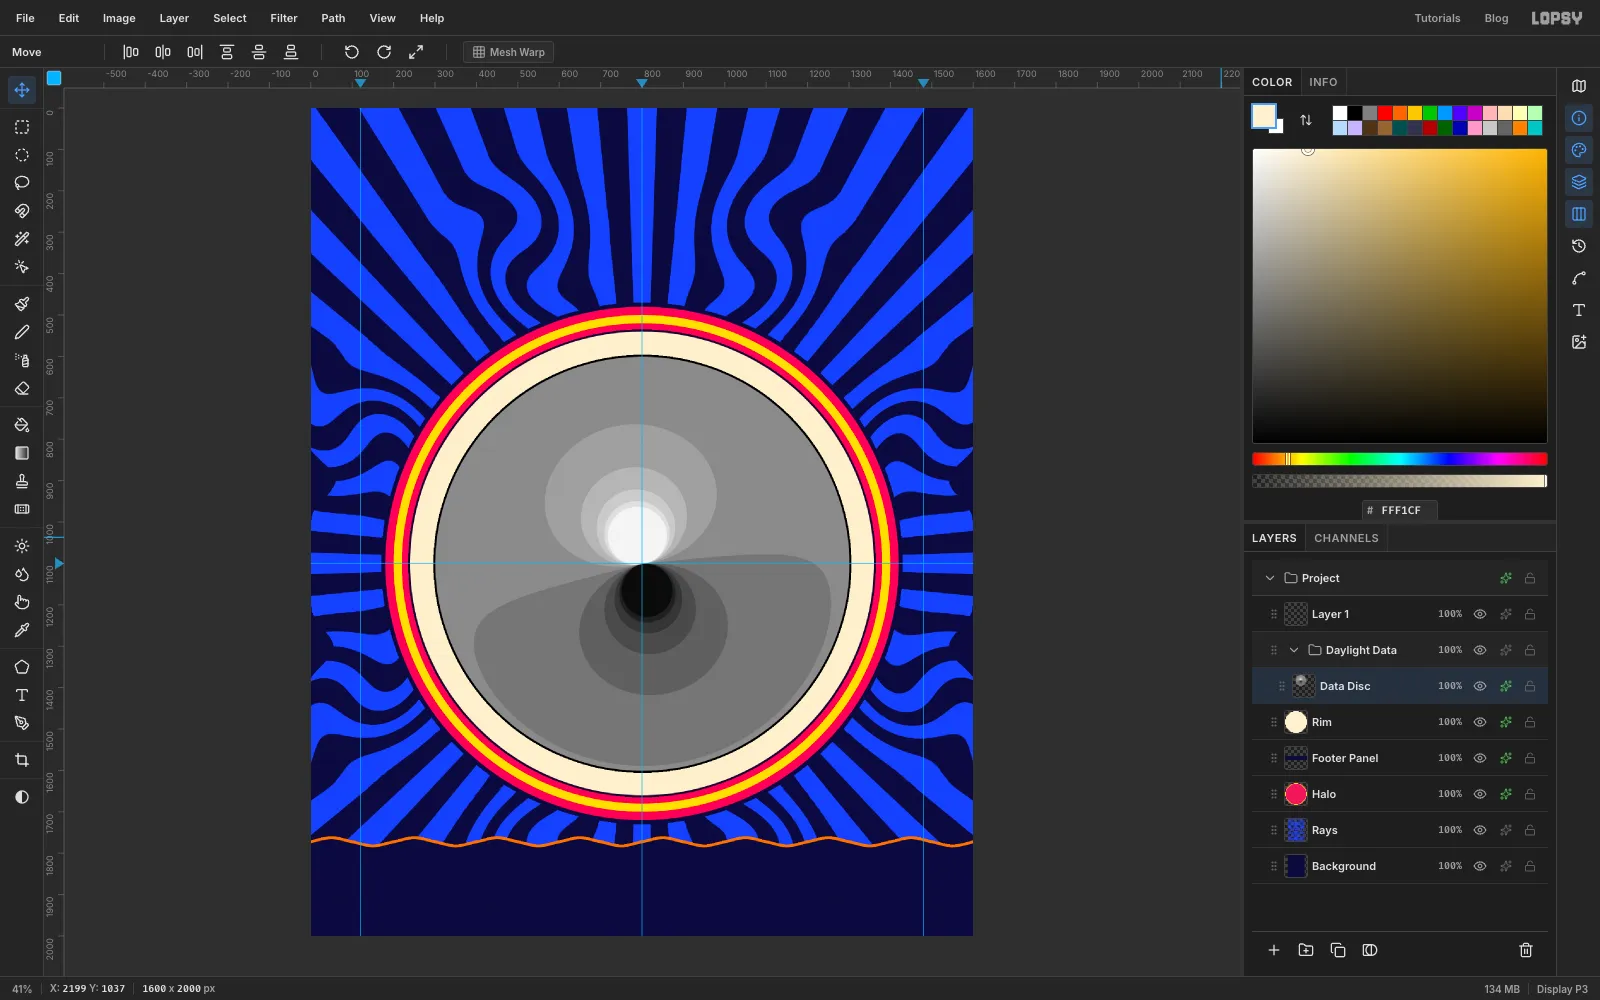
Press Cmd+D to drop the transform box and switch to the Move tool (V). The disc is 1000 px across, so its top-left corner belongs at 300, 600, with its centre on the crossing of the 800 and 1100 guides. Drag it close, then use the arrow keys to land it. Shift+arrow moves 10 px and a plain arrow moves 1 px. When it's right, the cream band around it is the same width all the way round.
Open the effects drawer and give
Data Disca Stroke of Width5in black. Close the drawer.You can already read the story in grey. The pale lobe above the Pole is the midnight sun in summer, and the dark lobe below it is the polar night in winter.
-
Colour the classes with a Gradient Map
Click the ✦ button on the
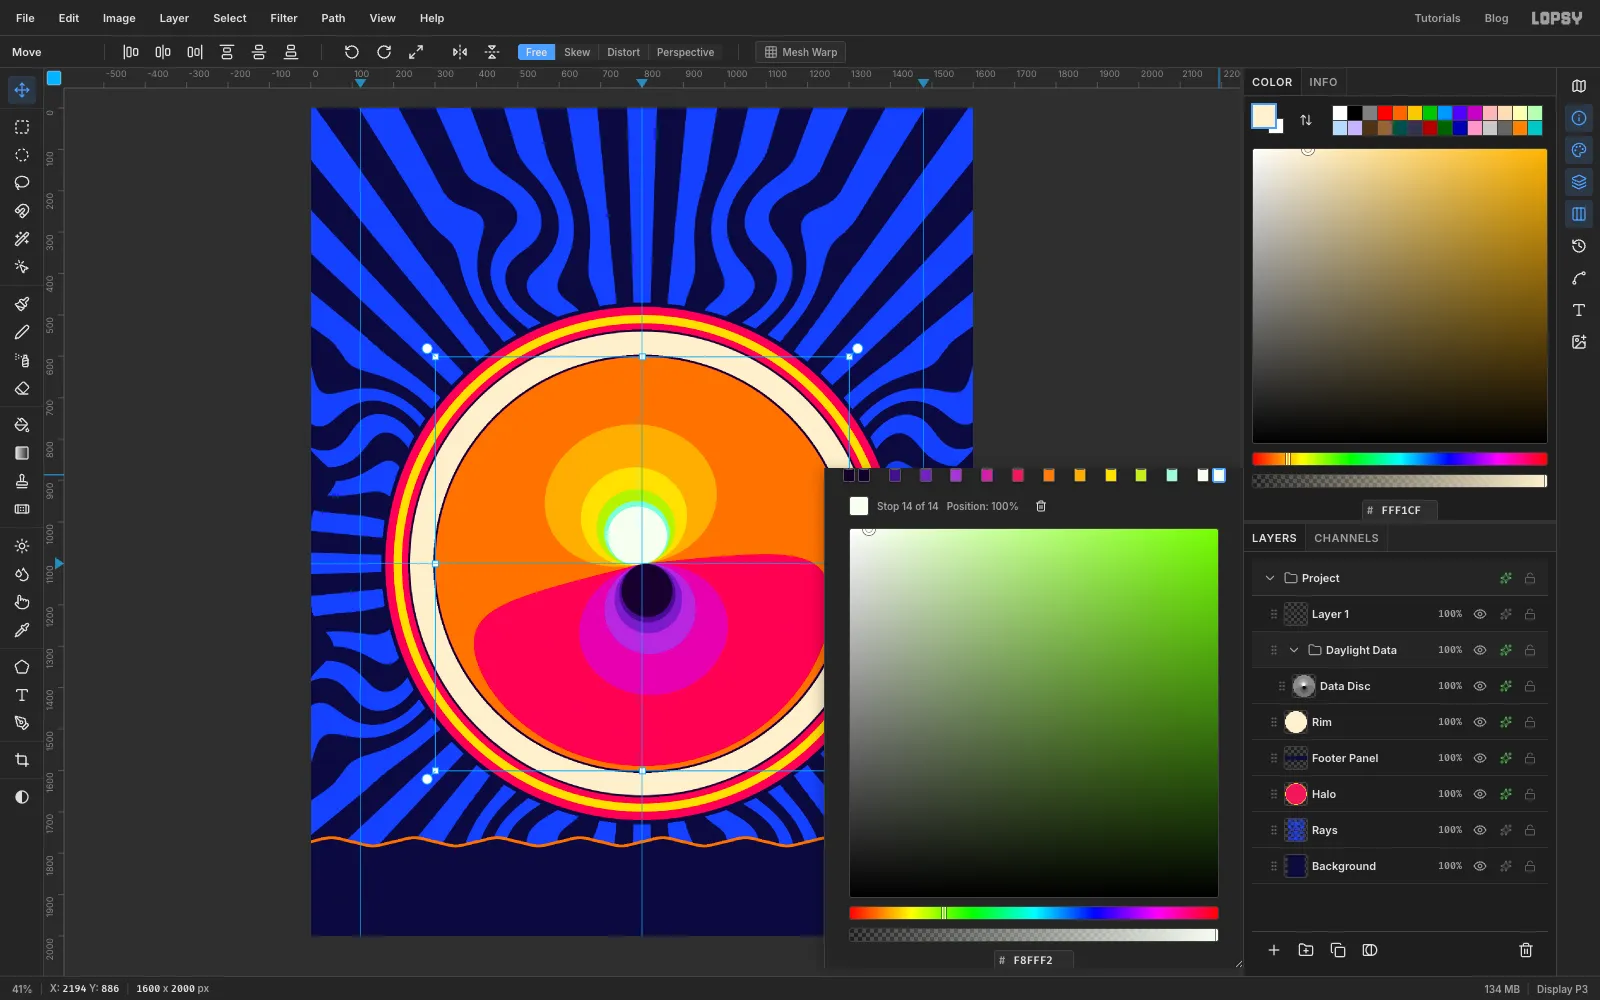
Daylight Datagroup row. For a group, the drawer shows adjustments instead of effects. Click Add Adjustment → Gradient Map. It starts as black to white.Each grey in the disc sits in the middle of its class, so put one stop at the middle of each class. First click all twelve positions on the bar, then colour them. If you click a hex field first, the drawer can scroll and the bar clicks miss. The readout under the bar shows each stop's position as you click. Aim for:
4%, 12.5%, 21%, 29%, 37.5%, 46%, 54%, 62.5%, 71%, 79%, 87.5% and 96%
Then click each stop handle from left to right and type its colour into the hex field:
- the end stop at 0%, and the stop at 4%:
- 12.5% , 21% , 29% , 37.5% , 46%
- 54% , 62.5% , 71% , 79% , 87.5%
- the stop at 96%, and the end stop at 100%:
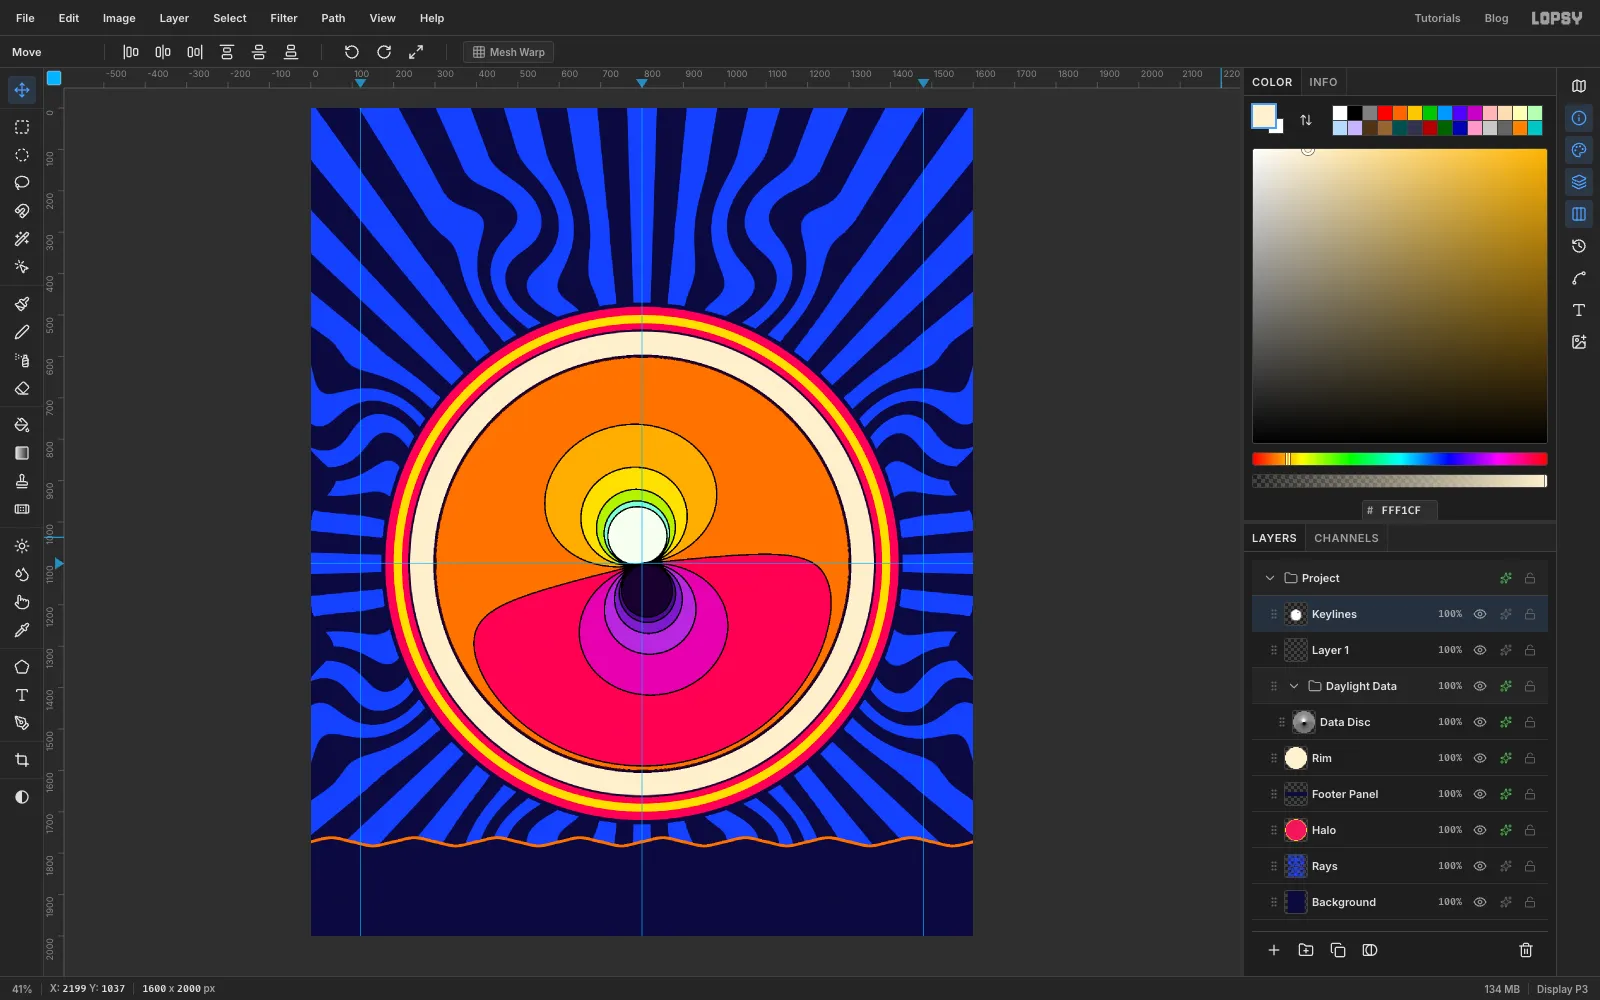
Close the drawer. The disc turns into a glowing eye: an orange top half (12–14 h), a hot-pink bottom half (10–12 h), a white sun above the Pole and a violet night below it.
-
Copy the data for the keylines
The bands need black outlines, like the inked keylines of a screen-printed poster. You'll make them from a copy of the grey data, outside the group so the Gradient Map doesn't touch them.
Cmd-click the
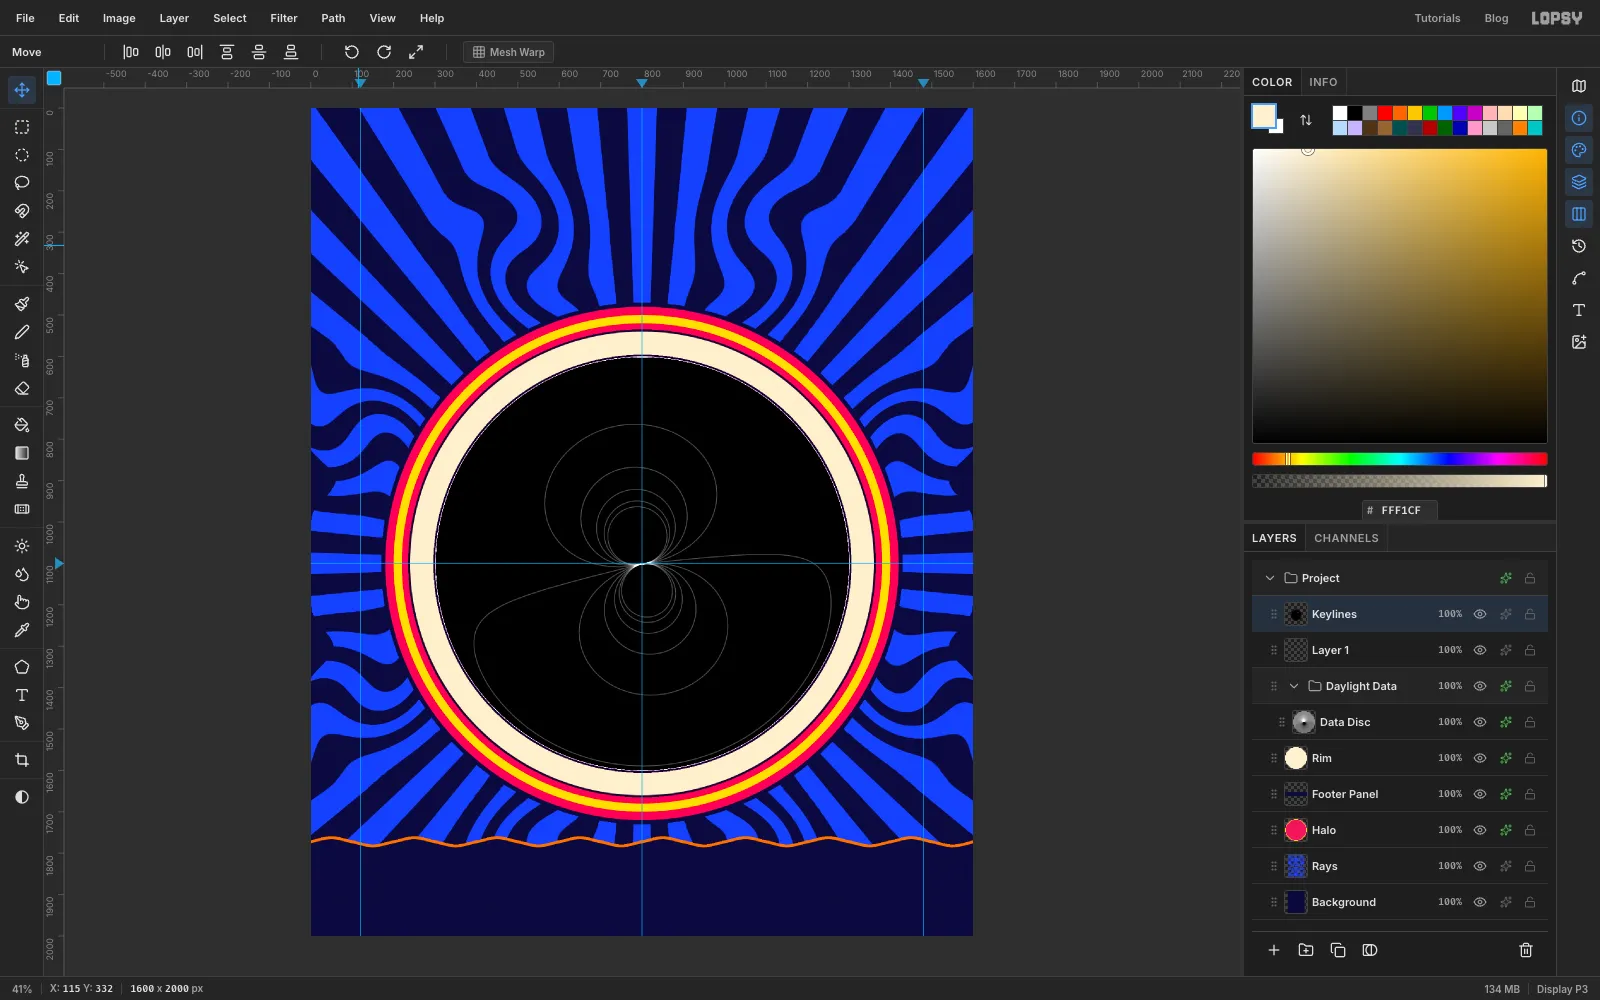
Data Discthumbnail to select its shape. Then click theData Discrow and press Cmd+C. ClickLayer 1, which sits above the group, and press Cmd+V. The paste lands in place, aboveLayer 1. Rename itKeylinesand press Cmd+D.Choose Filter → Find Edges. It runs immediately and turns the disc black, with a thin light line wherever two greys meet.
-
Turn the edges into ink
Still on
Keylines:- Filter → Gaussian Blur…, Radius
3. This spreads the hairlines out. - Filter → Threshold…, Level
22. Every line becomes solid white, about 3 px wide. - Filter → Invert. You now have black lines on white.
- Open the effects drawer and set the layer's Blend to Multiply. White disappears in Multiply, so only the black lines remain.
Close the drawer.
- Filter → Gaussian Blur…, Radius
-
Draw the latitude rings
Click Add Layer and name it
Latitude Rings. Use the exact-corners dialog for a circle from 467, 767 to 1133, 1433 (radius 333, which is 30°N). Fill it with .Choose Select → Shrink…, type
3and click Apply, then press Delete. You're left with a 3 px ring.Press Cmd+D and do the same for 60°N, the smaller circle from 633, 933 to 967, 1267 (radius 167). Press Cmd+D and set the layer's opacity to
80% with the opacity control on its row.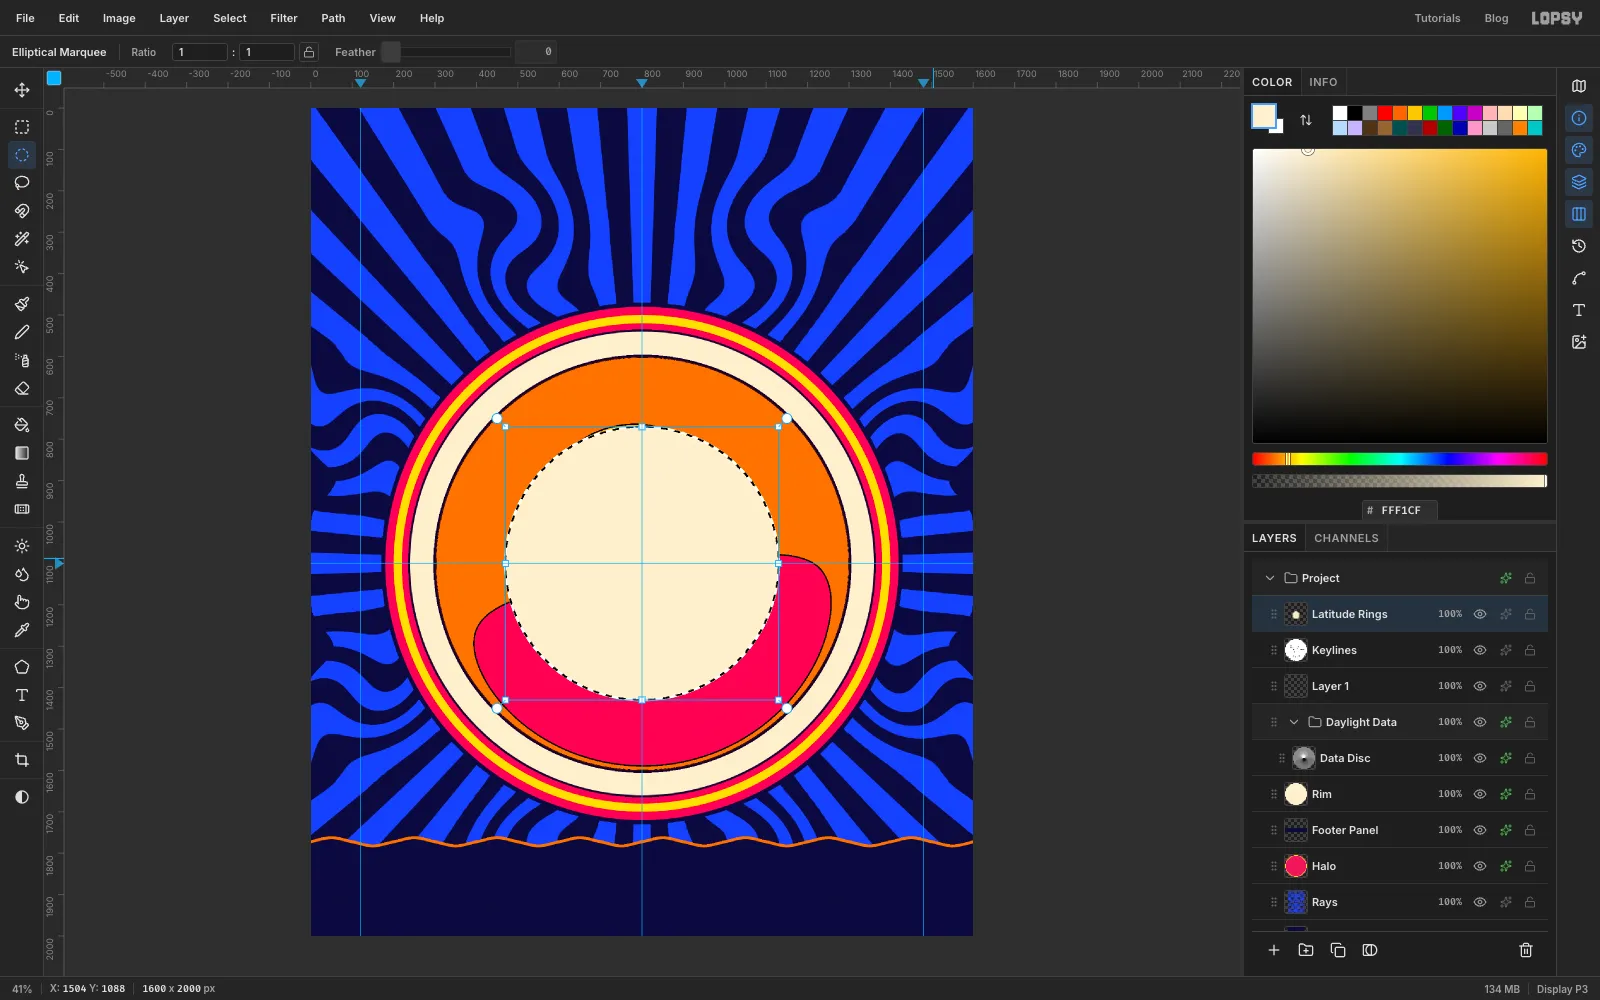
-
Draw the month spokes with Radial Symmetry
Click Add Layer and name it
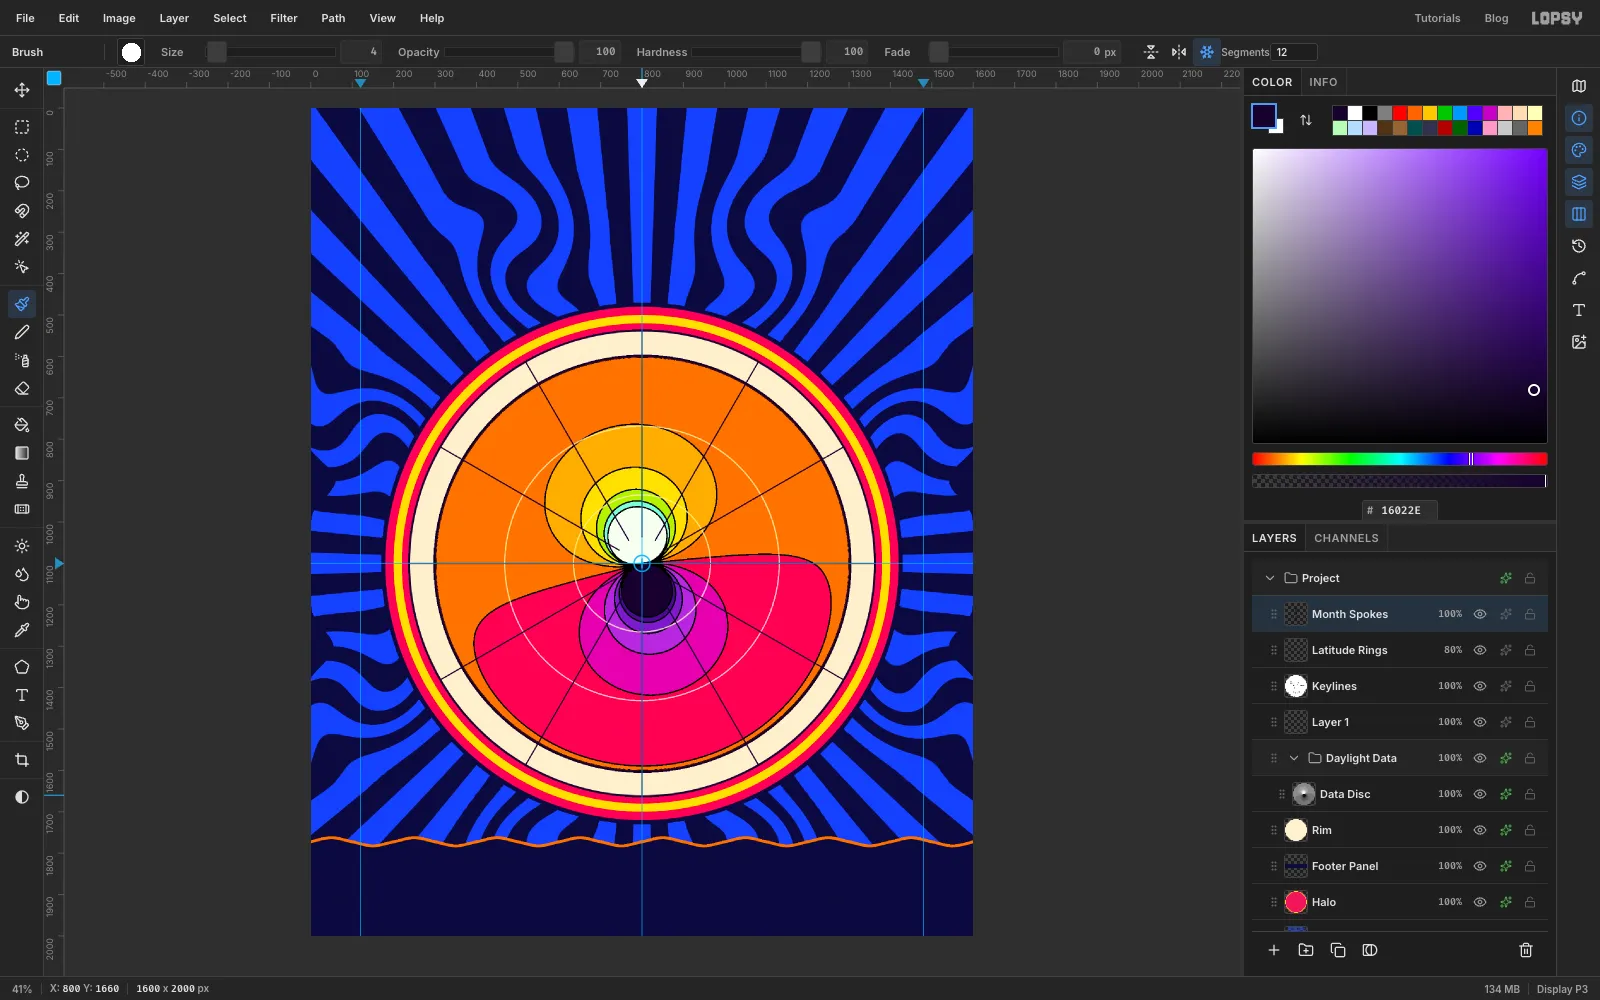
Month Spokes. Pick the Brush (B) and set Size4, Hardness100and Opacity100. Set the foreground to .In the Brush options bar, click Radial Symmetry and set Segments to
12. Cmd-click the Pole (800, 1100) to move the symmetry centre there.Now draw one spoke. Click just below the Pole at 800, 1164, then Shift-click at the bottom of the rim, 800, 1660. The symmetry paints the other eleven. Each spoke marks a twelfth of the year, starting from January 1 at the bottom.
Click Radial Symmetry again to turn it off.
-
Clear the Pole
The spokes crowd the polar lobes, so stop them at the 60°N ring. With
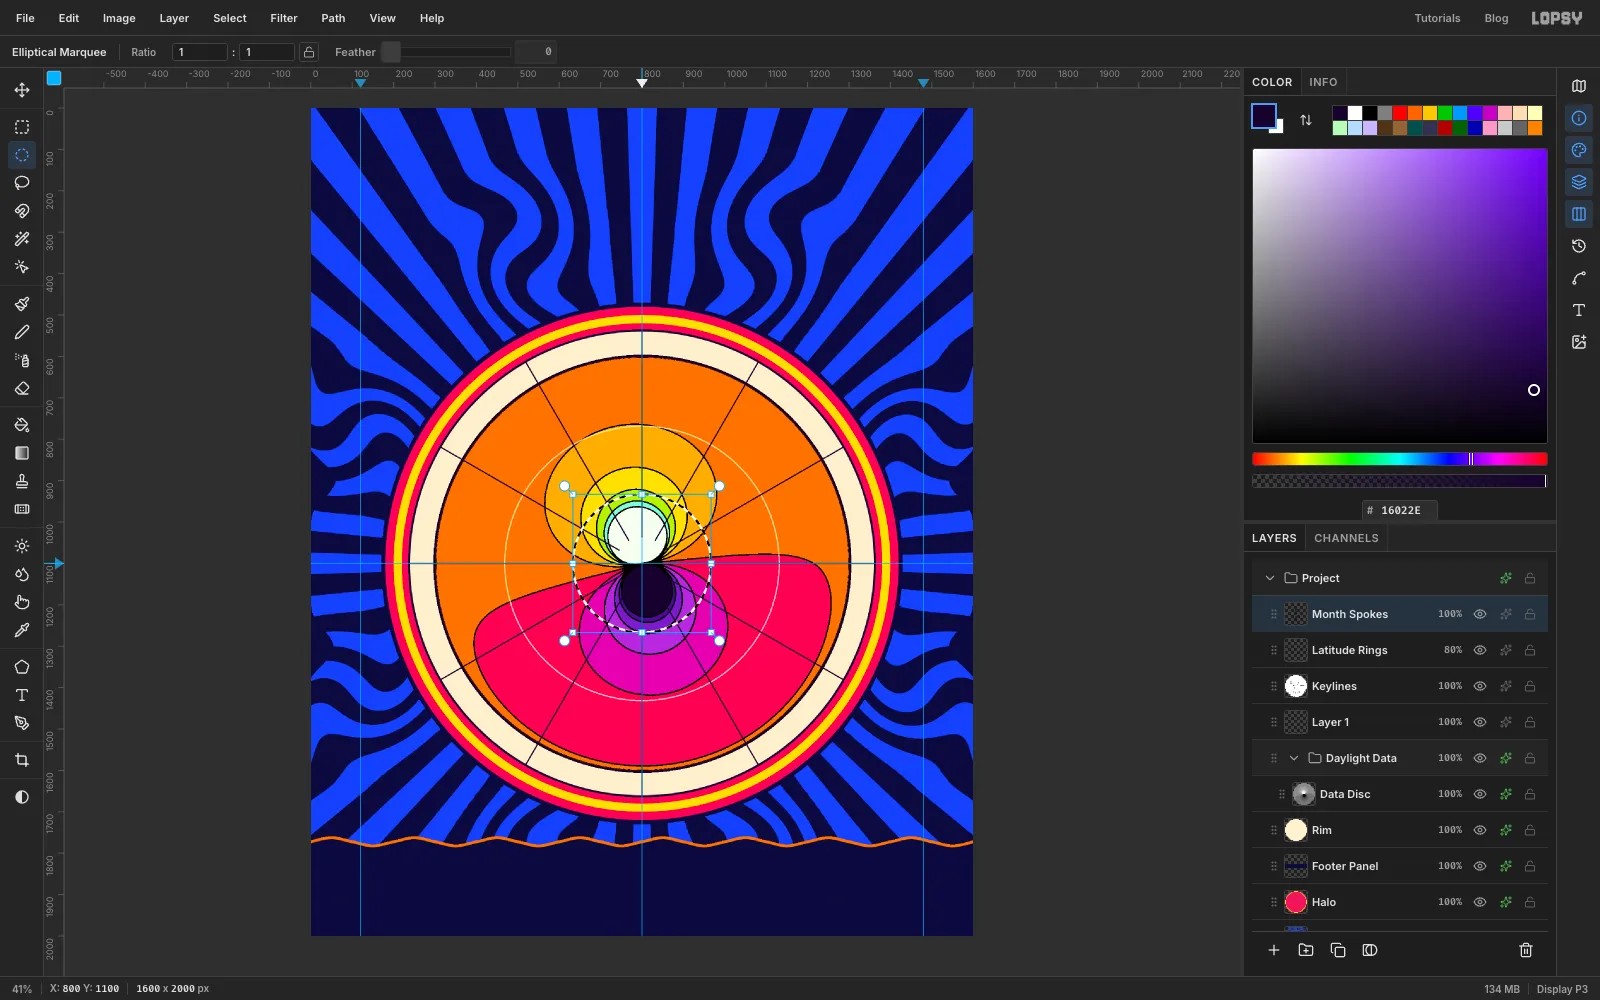
Month Spokesselected, make a circle from 633, 933 to 967, 1267 with the exact-corners dialog and press Delete. Press Cmd+D and set the layer's opacity to55%.All the keylines meet at the Pole, so clean that up too:
- Press Cmd+D, click
Keylines, make a circle from 782, 1082 to 818, 1118 and press Delete. - Press Cmd+D and click
Latitude Rings. Fill a circle from 790, 1090 to 810, 1110 with . - Press Cmd+D again and fill a smaller circle from 793, 1093 to 807, 1107 with .
Press Cmd+D. You now have a small cream dot with a dark ring marking the Pole.
- Press Cmd+D, click
-
Set the month names and turn them to the rim
Click
Month Spokes, then Add Layer, and name the new layerLabels Anchor. New text always lands just above the selected layer, so clickLabels Anchorbefore you create each label in the rest of the tutorial.Pick the Text tool (T). Choose IBM Plex Mono, weight SemiBold, size
23, colour , and set Letter spacing to3in the Text panel.Each month sits between two spokes, halfway across the cream band. JAN sits just left of the bottom spoke, and the months run clockwise from there. Click on empty canvas near each spot, type the name and press Tab to finish. Then switch to the Move tool and nudge it with the arrow keys until it's centred in its wedge. If you want exact centres, they are:
- JAN 663, 1612 · FEB 425, 1475 · MAR 288, 1237 · APR 288, 963 · MAY 425, 725 · JUN 663, 588
- JUL 937, 588 · AUG 1175, 725 · SEP 1312, 963 · OCT 1312, 1237 · NOV 1175, 1475 · DEC 937, 1612
Text layers are named after their text, so these rows read
JAN,FEBand so on. In the screenshots they have the author's own names, such asMonth APR.Create the labels from the bottom of the page upwards (JAN and DEC first, JUN and JUL last). A click that lands inside an earlier label's box edits that label instead of starting a new one.
Next, turn each name so it follows the rim. The names at the top and bottom tilt to follow the curve, and the ones on the sides turn to read up the left and down the right. With the Move tool, select the name's row, press Cmd+D, and drag the round rotate handle just outside its top-right corner. Use these angles (clockwise is positive):
- JAN
+15°, FEB+45°, MAR+75° - APR
−75°, MAY−45°, JUN−15° - JUL
+15°, AUG+45°, SEP+75° - OCT
−75°, NOV−45°, DEC−15°
Press Cmd+D after each rotation, then nudge the label back to its spot.
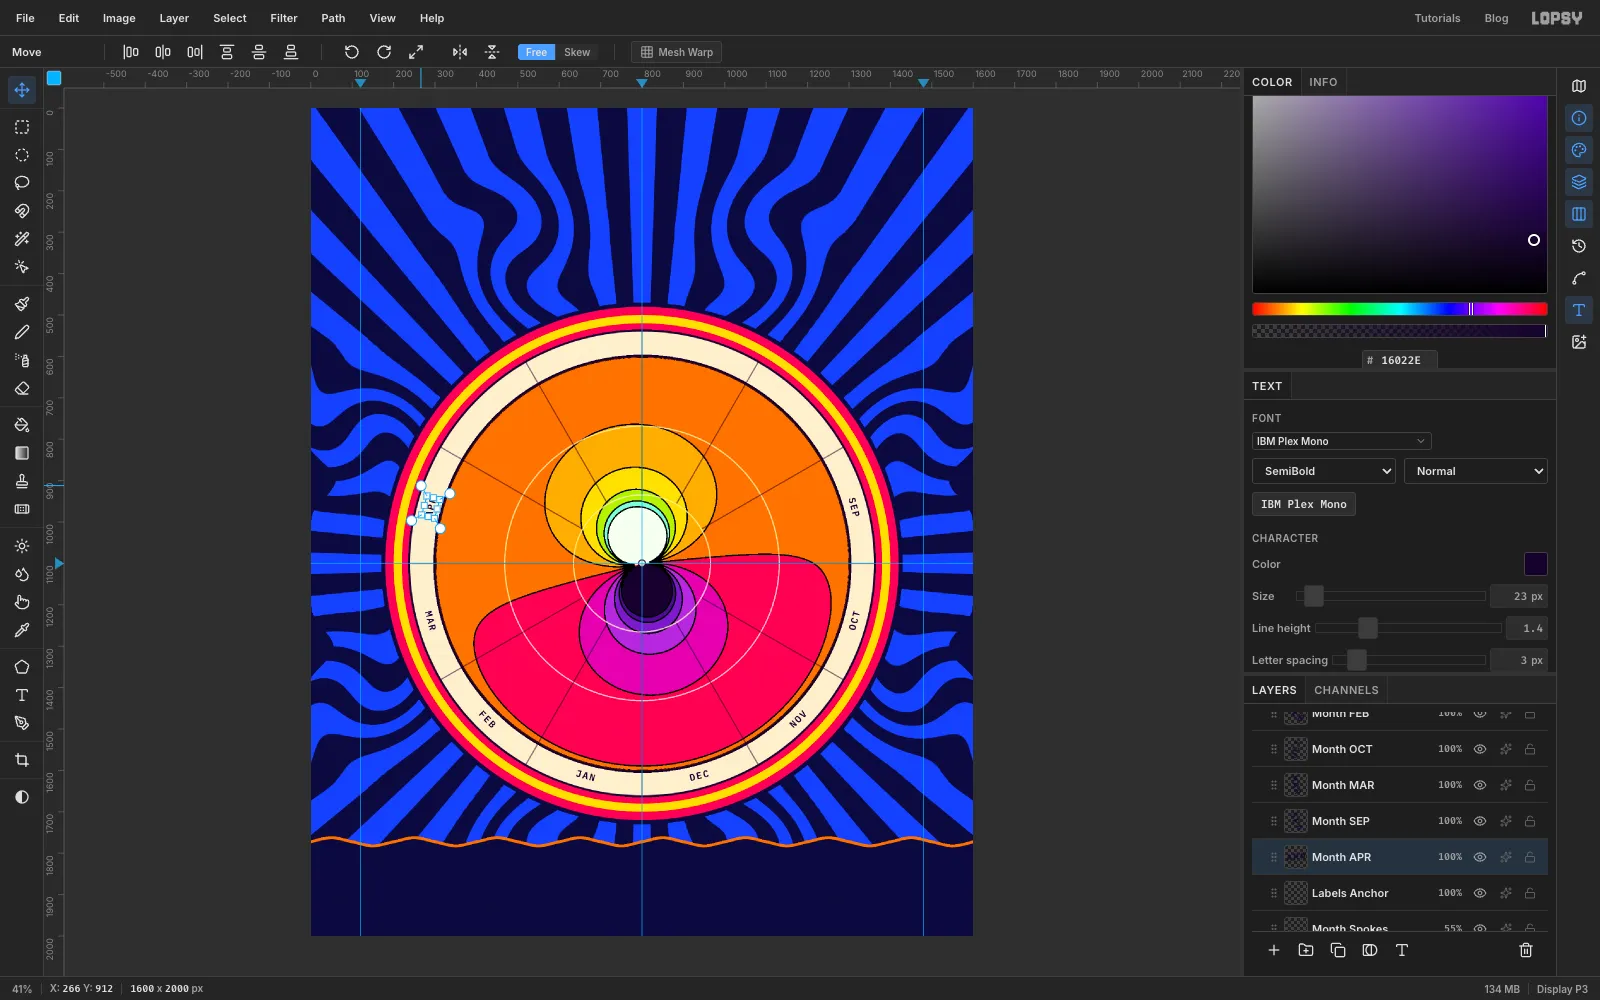
-
Read the year around the rim
Check the ring of names. The top six and bottom six read left to right. The ones on the sides read up the left side and down the right side, the way a clock face reads. Every name should sit in the middle of the cream band, clear of the outlines on both sides.
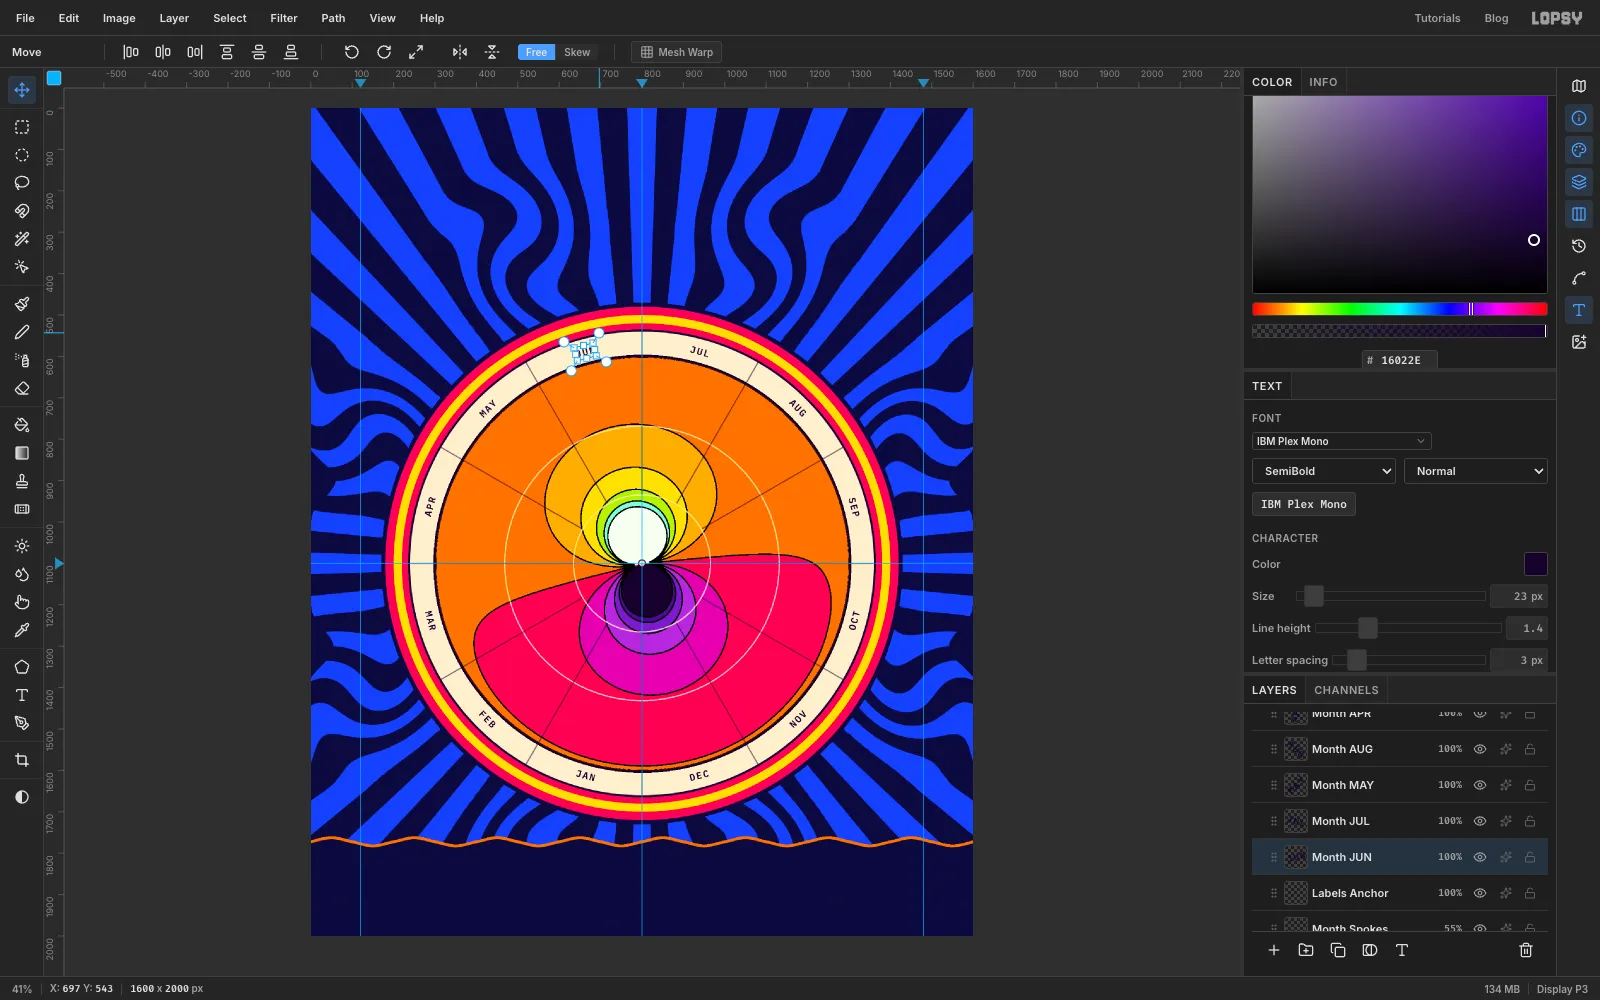
-
Label the poles, the latitudes and the Equator
Click
Labels Anchorfirst. The text settings restyle whatever text layer is selected, so if a month name were still selected, the next changes would land on it. Then, with the Text tool, keep IBM Plex Mono SemiBold, set Letter spacing to1and Align to Center. Before each label below, clickLabels Anchor, set its size and colour, then click the canvas. Work from the bottom up:THE EQUATOR,NEVER DIPS,BELOW 12 Hon three lines (press Enter between them), size15, , centred at 922, 1500.POLAR/NIGHTon two lines, size19, , centred at 810, 1164.60°Nat 633, 1076 and30°Nat 467, 1076, size20, . Each sits on its ring, just above the horizontal spoke. Give each one a Stroke effect of Width9in , the same orange as the field behind it. The stroke knocks the ring and the outlines out from behind the letters.MIDNIGHT/SUN, size17, , centred at 787, 1034.
The Equator note explains the thin orange crescent along the bottom of the rim. Near the Equator the day never gets shorter than 12 hours, even in December, so that sliver is data, not a slip. Point to it with a leader: click
Keylines, pick the Pencil (N) at Size2in black, click just under the note at about 922, 1538, and Shift-click on the crescent at about 969, 1563.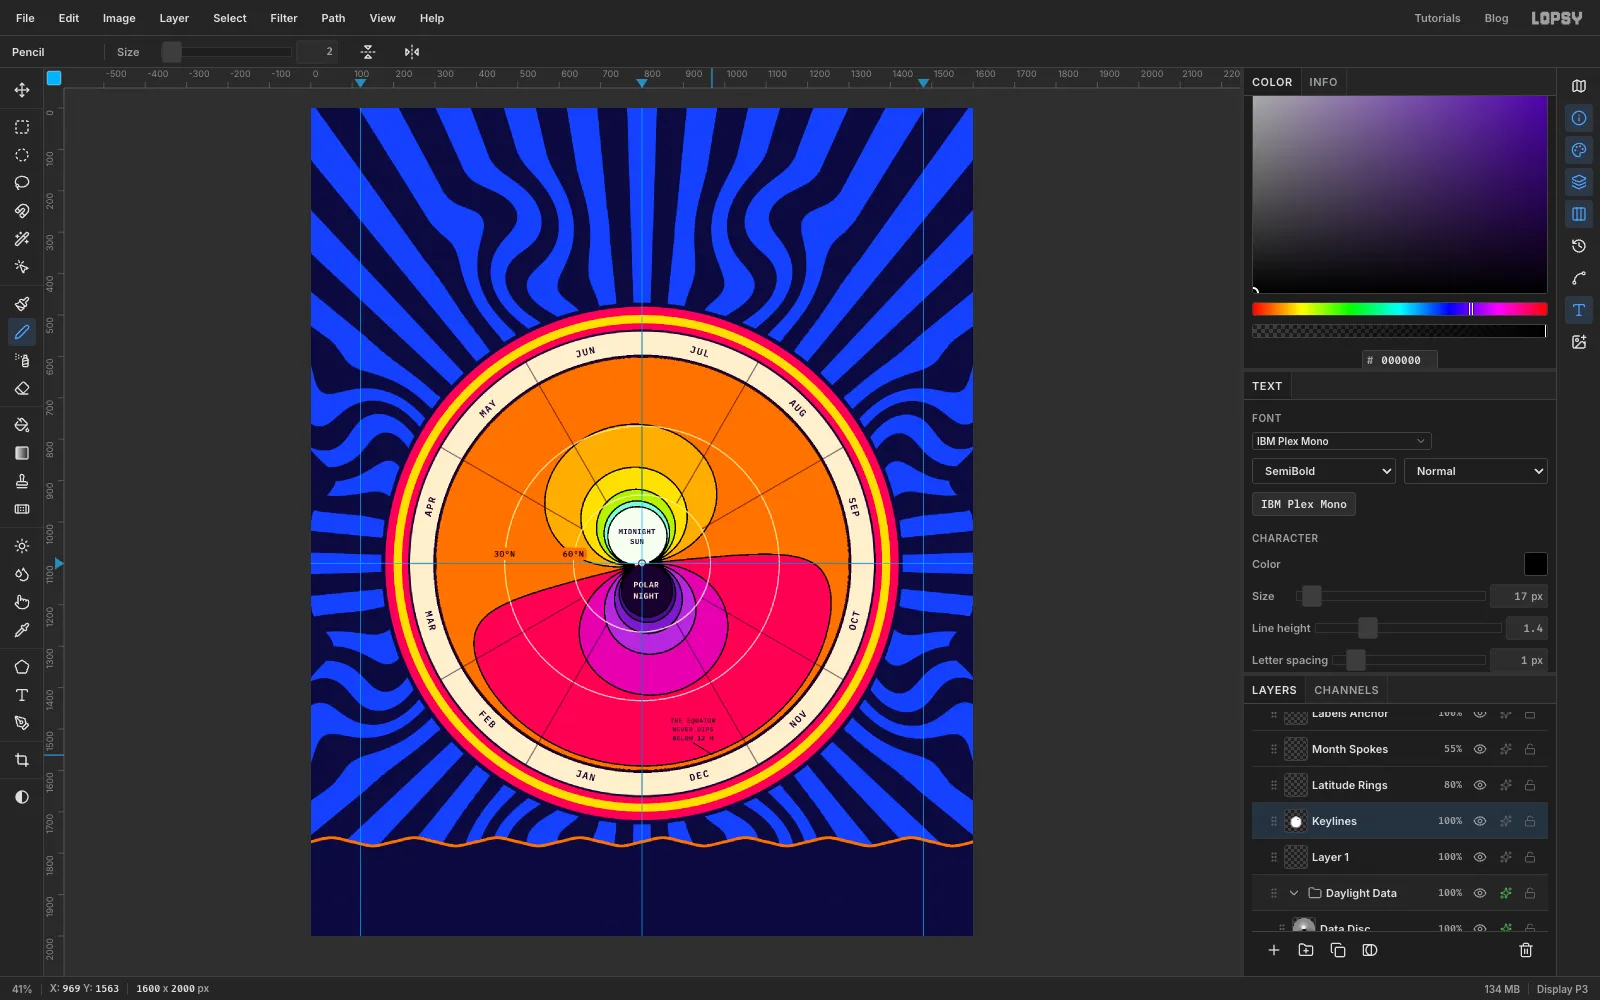
-
Draw an arch for the title
Click
Labels Anchor, then Add Layer, and name the new layerTitle Anchor.With the Pen tool, draw an open arch through seven smooth anchors, dragging each a little to the right as you place it: 225, 300 · 412, 249 · 598, 220 · 785, 210 · 972, 220 · 1158, 249 · 1345, 300. The arch is centred 15 px left of the page centre on purpose. Sonsie One's T has a long swash on the right, so centring the path at 800 makes the word look shifted to the right. Click the ✓ Commit path button in the options bar. Don't press Enter, because that strokes the path with paint.
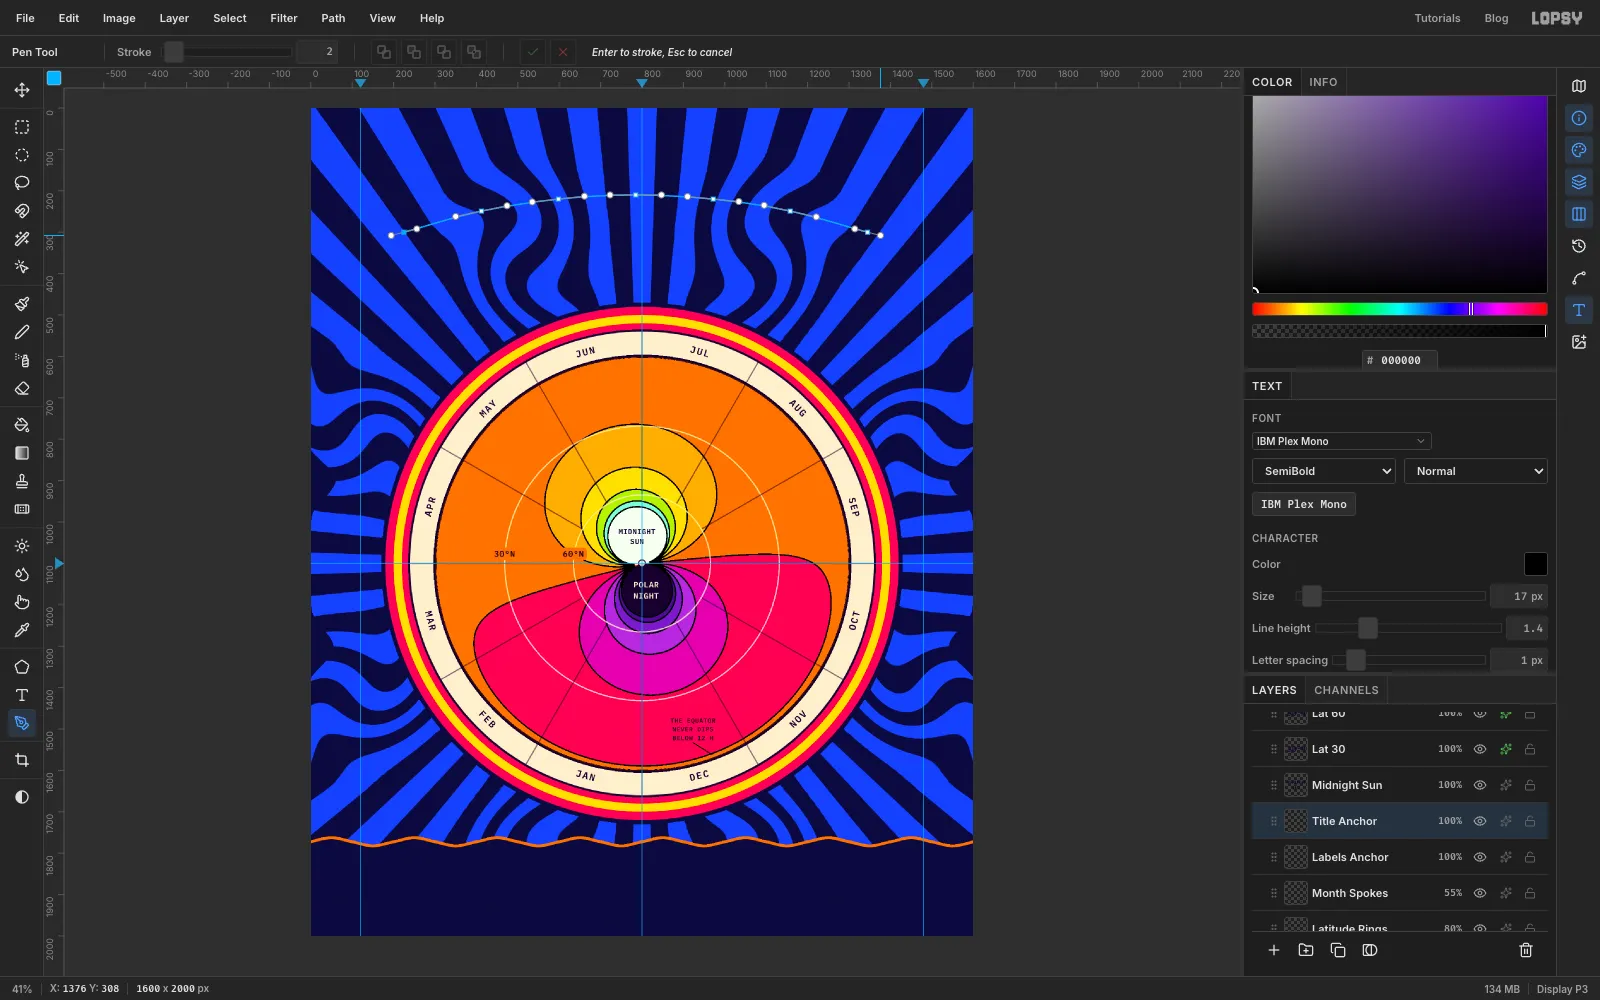
-
Set DAYLIGHT on the arch
Click
Title Anchor. With the Text tool, choose Sonsie One, size150, colour , and set Letter spacing to4. Click anywhere in the empty sky, typeDAYLIGHTand press Tab.In the Text options bar, open the Path menu and choose the last path in the list, which is the arch you just drew. Set Align to Center, so the word centres on the arch. To hide the path's outline, click its row in the Paths panel.
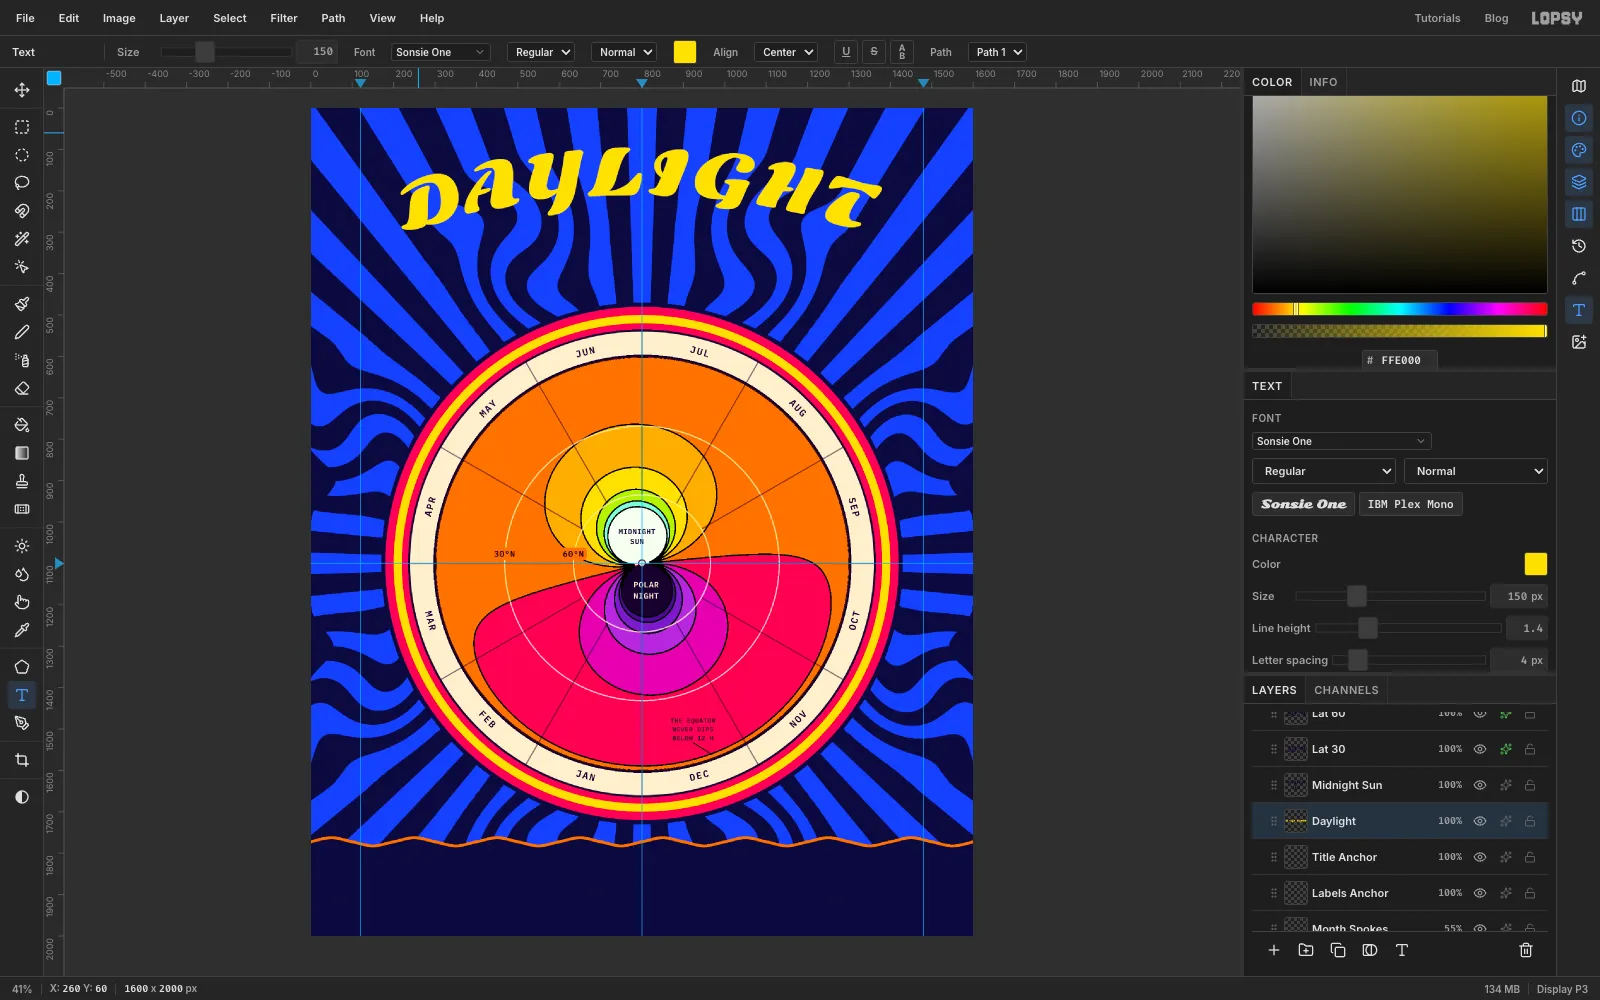
-
Ride OSCILLATIONS on a wave
Click
Title Anchoragain. With the Pen, draw an open wave from 385, 406 to 1215, 406, one and a half waves long. Place smooth anchors at:- 385, 406
- crest 523, 378
- 662, 406
- trough 800, 434
- 938, 406
- crest 1077, 378
- 1215, 406
Click ✓ Commit path.
Click
Title Anchor. Set the Text tool to Sonsie One size76, colour , Letter spacing3. Click in empty sky, typeOSCILLATIONSand press Tab. In Path, choose the last path in the list (the wave), then set Align to Center. Hide the path in the Paths panel.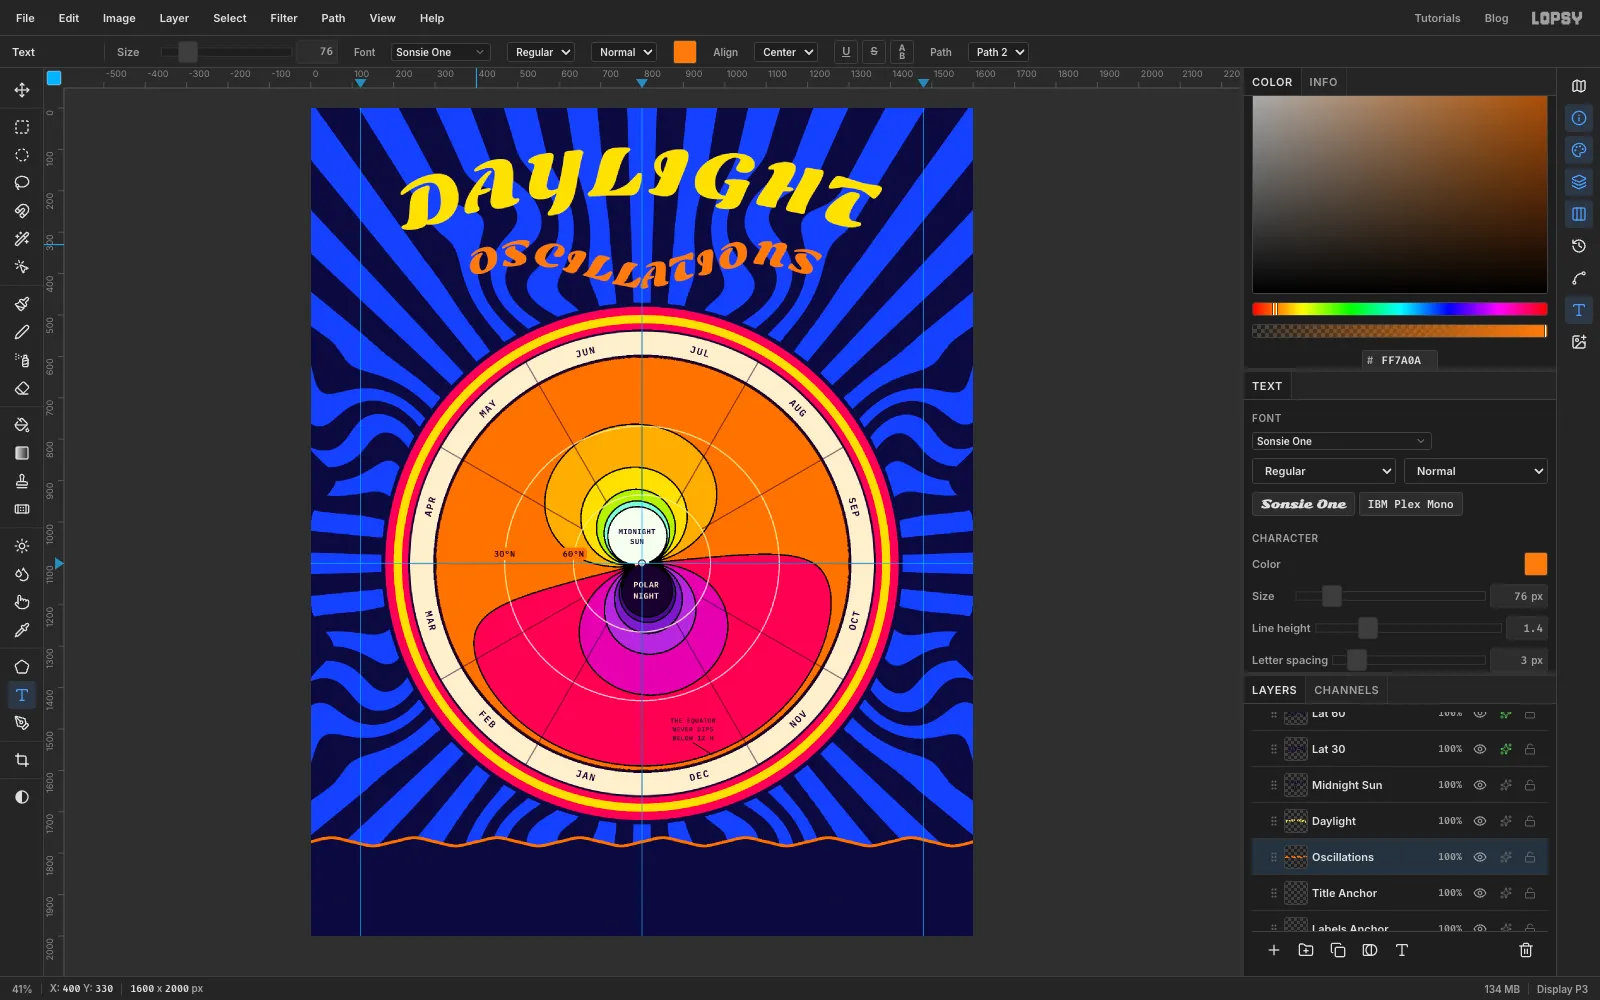
-
Build the legend inside the mapped group
Here's a neat trick: if the legend swatches are the same greys as the data, inside the same group, the Gradient Map colours them for you, and they can't drift out of sync with the chart.
Click
Data Discand Add Layer. The new layer lands inside the group. Name itLegend Swatches. Make twelve 70 × 36 px rectangles in a row with the Rectangular Marquee's exact-corners dialog, pressing Cmd+D before each one. The first runs from 380, 1824 to 450, 1860, and each next one starts 70 px further right. Fill them with these greys, left to right:, , , , , , , , , , ,
Press Cmd+D. Add a Stroke effect with Width
3in white (). The darkest swatch is almost the same colour as the panel, and the outline keeps it from disappearing.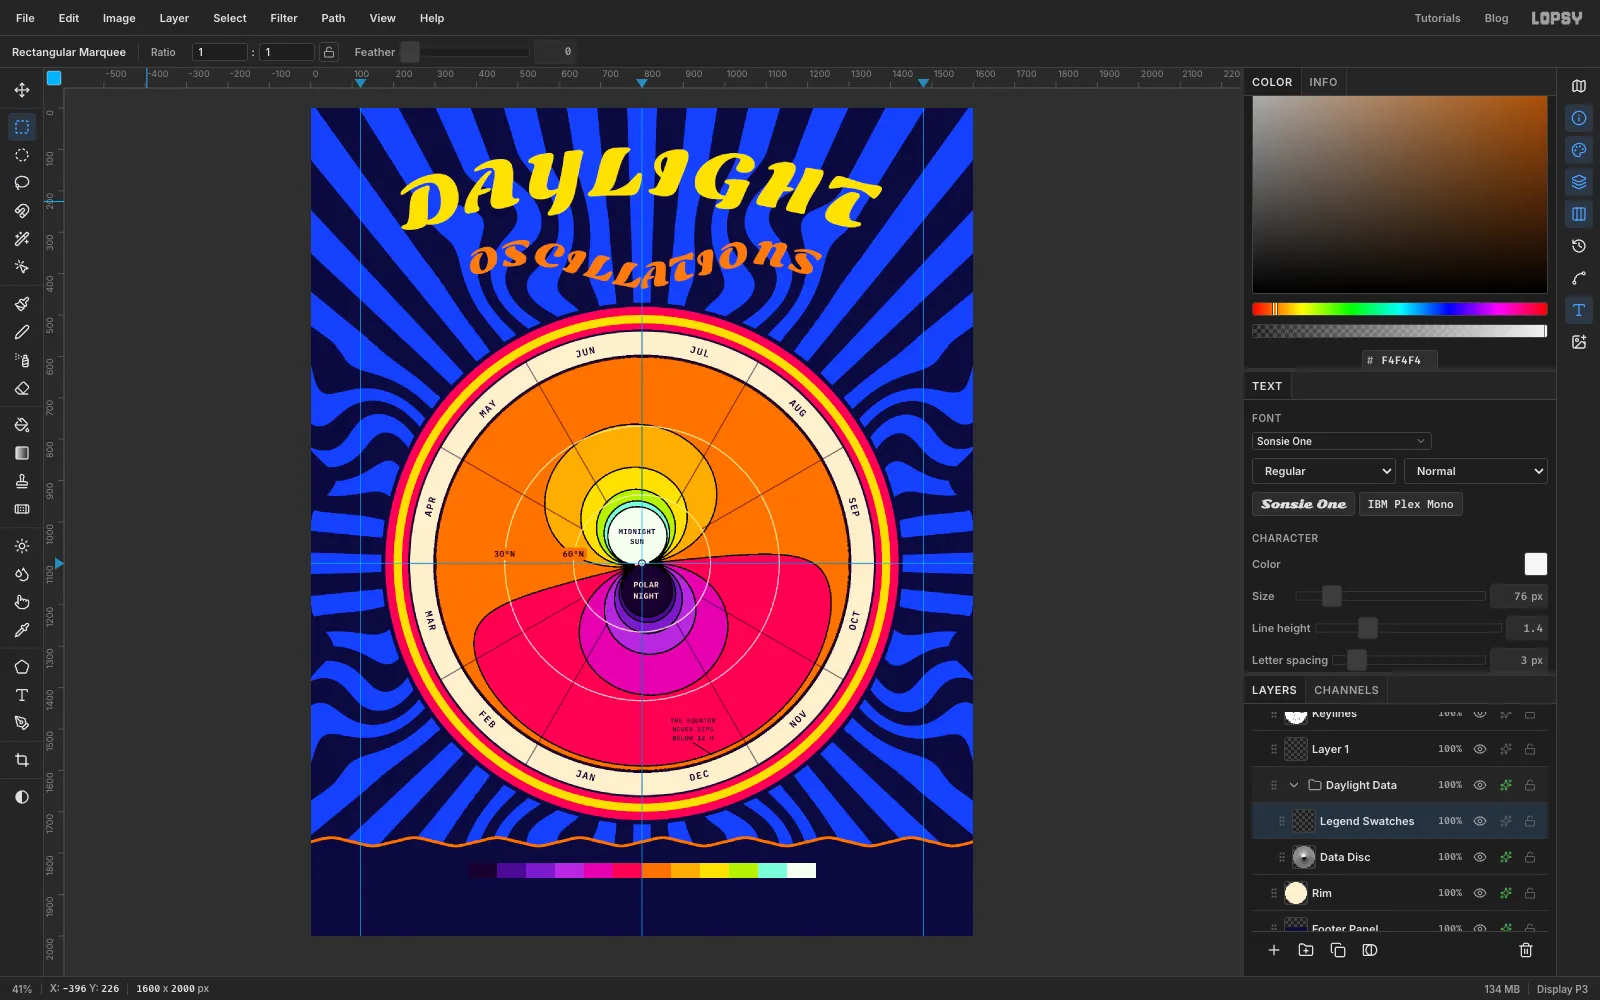
-
Divide the swatches
Click
Keylines. Pick the Pencil, set Size3, and set the foreground to black. Draw a line at each boundary between swatches: click at the top edge (y 1824) at x 450, 520, 590 and so on up to 1150, then Shift-click straight down at the bottom edge (y 1860). BecauseKeylinesis in Multiply, these lines match the chart's outlines.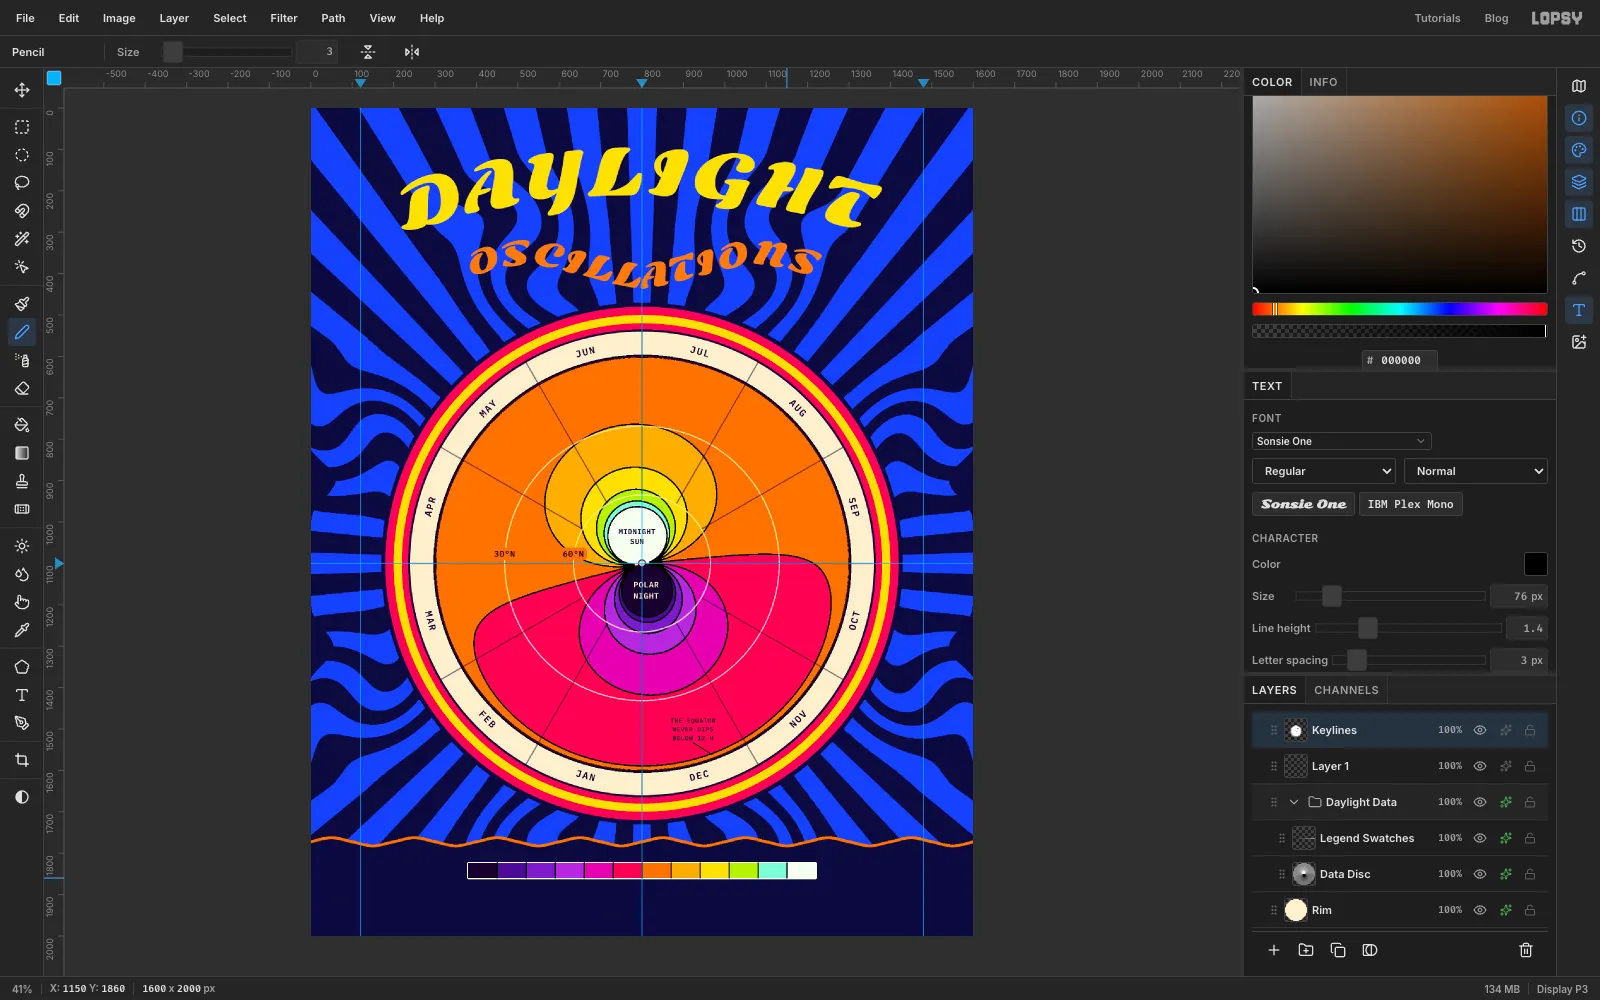
-
Label the legend and add the credits
Click
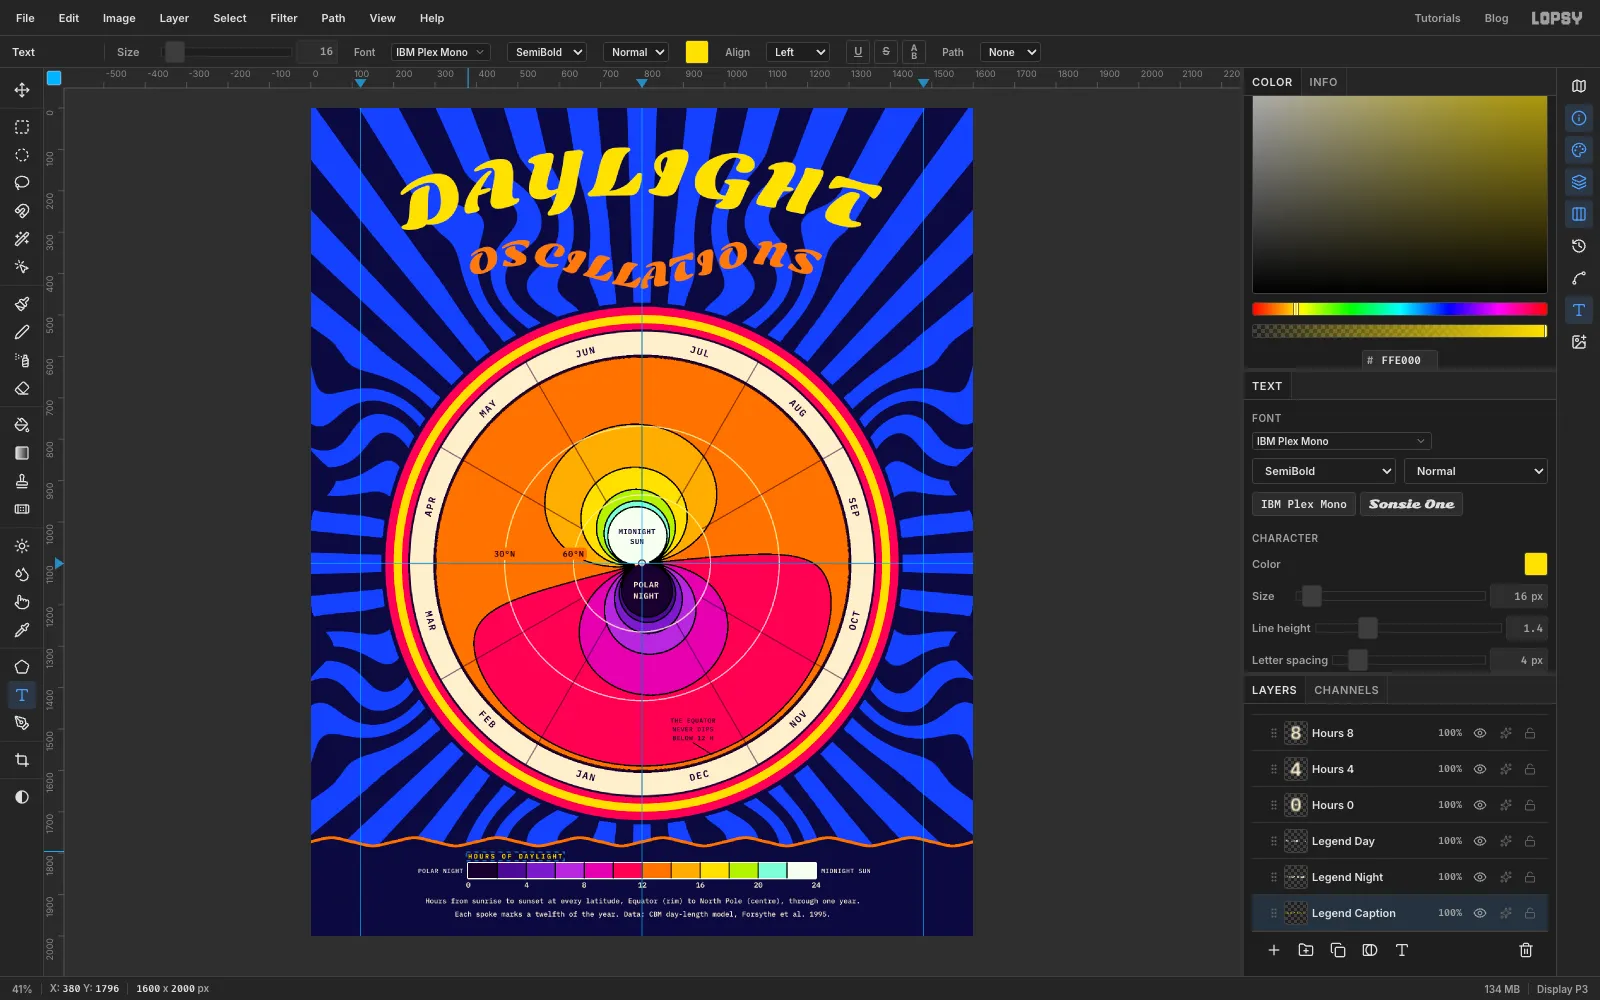
Labels Anchorfirst, then set Align back to Left. ClickLabels Anchoragain before each label. Create these from the bottom up, with IBM Plex Mono in unless noted. Centre each one with the Move tool and the arrow keys, as you did the month names.- Two credit lines, Medium, size
17, Letter spacing0, centred on the page. Make the lower one first, centred at y 1948:Each spoke marks a twelfth of the year. Data: CBM day-length model, Forsythe et al. 1995.Then the upper one at y 1916:Hours from sunrise to sunset at every latitude, Equator (rim) to North Pole (centre), through one year. - The hours, SemiBold size
18, Letter spacing0, each centred under its boundary at y 1876. Work right to left:24at x 1220,20at 1080,16at 940,12at 800,8at 660,4at 520 and0at 380. - End labels, Medium size
15, Letter spacing1. PutMIDNIGHT SUNjust right of the bar, starting at x 1236, thenPOLAR NIGHTjust left of it, ending at x 364. Centre both on the bar's middle, y 1842. - The caption
HOURS OF DAYLIGHT, SemiBold size16, colour , Letter spacing4. Click at 380, 1796 so its top-left corner lines up with the bar's left edge.
- Two credit lines, Medium, size
-
Ink the title
Click the
DAYLIGHTrow and open its effects drawer:- Stroke: Width
9, colour - Drop Shadow: Offset X
10, Offset Y12, Blur0, Spread0, Opacity100, colour
A shadow with no blur reads like a second ink colour printed slightly out of register, a staple of psychedelic posters. Do the same for
OSCILLATIONS, with a Stroke of Width7in and a Drop Shadow of Offset X6, Offset Y8, Blur0, Opacity100, colour .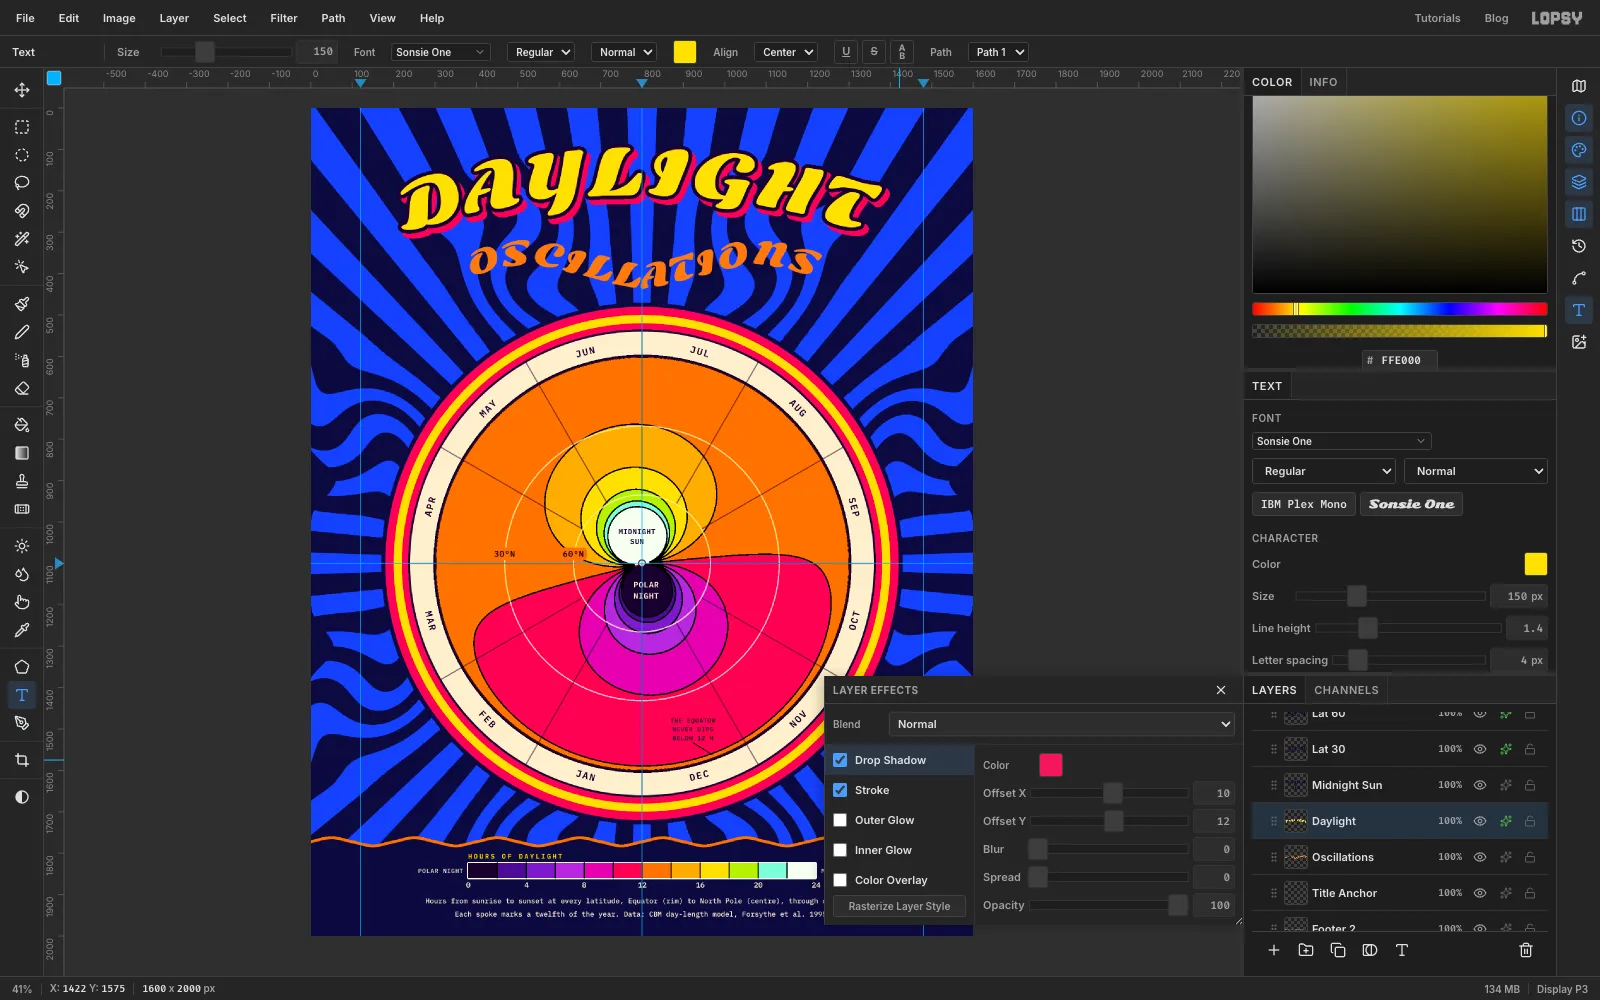
- Stroke: Width
-
Draw a sparkle with the Pen
Click
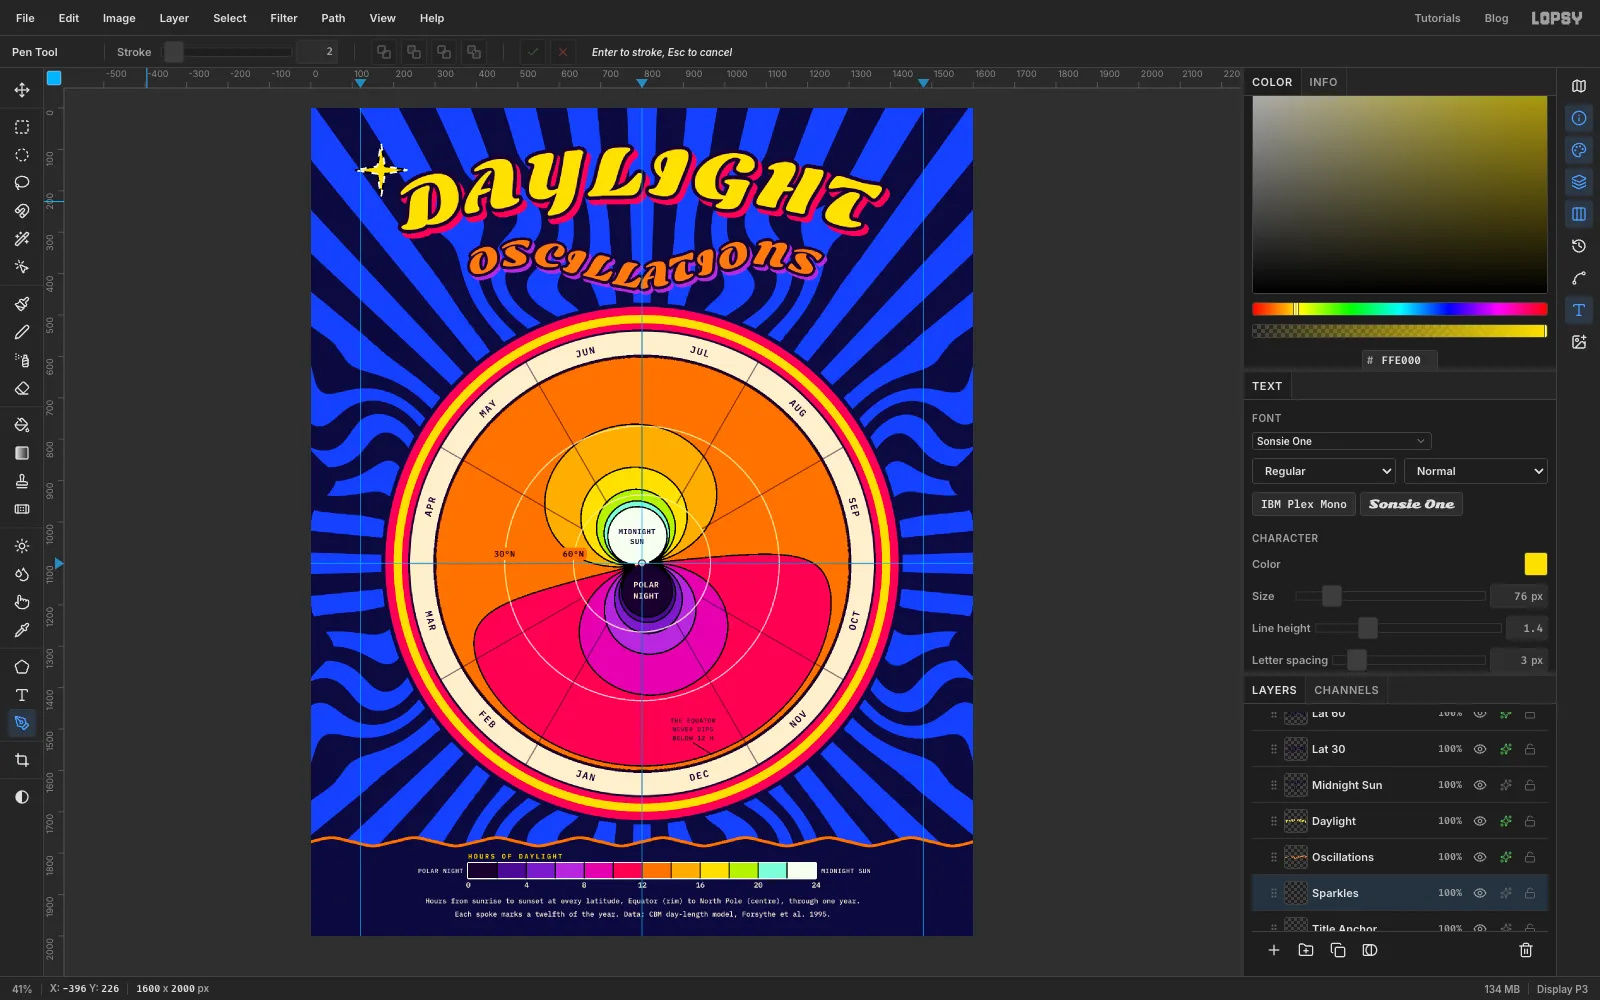
Title Anchor, then Add Layer, and name the new layerSparkles.With the Pen, click eight corner points around 170, 150, alternating between a long tip 64 px out and a short inner corner 13 px out diagonally: 106, 150 · 161, 141 · 170, 86 · 179, 141 · 234, 150 · 179, 159 · 170, 214 · 161, 159. Click the first point to close the path.
In the Paths panel, click Path to Selection, then Delete Path. Fill the selection with .
-
Copy, paste and scale the sparkle
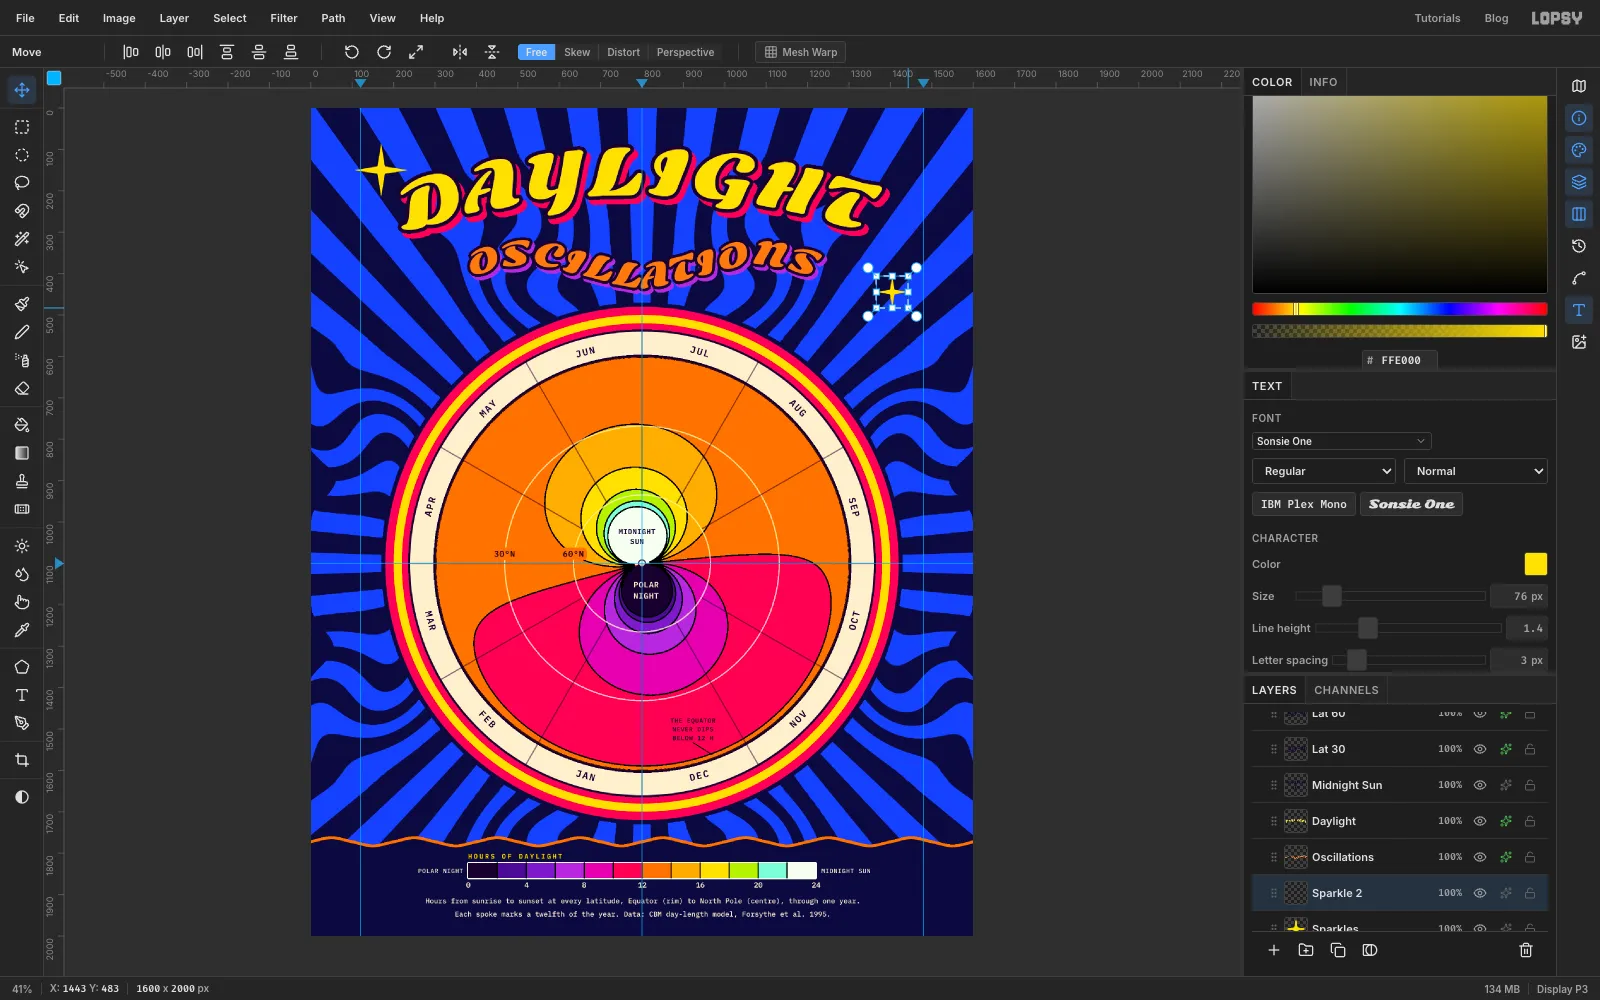
Keep the selection and press Cmd+C. Then, for each copy:
- Press Cmd+V. The copy is pasted in place on a new layer, and Lopsy switches to the Move tool.
- Drag the copy to its spot.
- Press Cmd+D, pick the Rectangular Marquee (M) and draw a box just around the copy. Switch back to the Move tool (V).
- Cmd-drag a corner handle to scale it evenly. Press Cmd+D.
Before each paste, click the
Sparklesrow so every copy lands just above it. Place three copies:- 1430, 470, scaled to about 60%
- 1478, 118, scaled to about 80%, sitting off the end of DAYLIGHT
- 150, 560, scaled to about 45%
-
Rotate the small sparkles
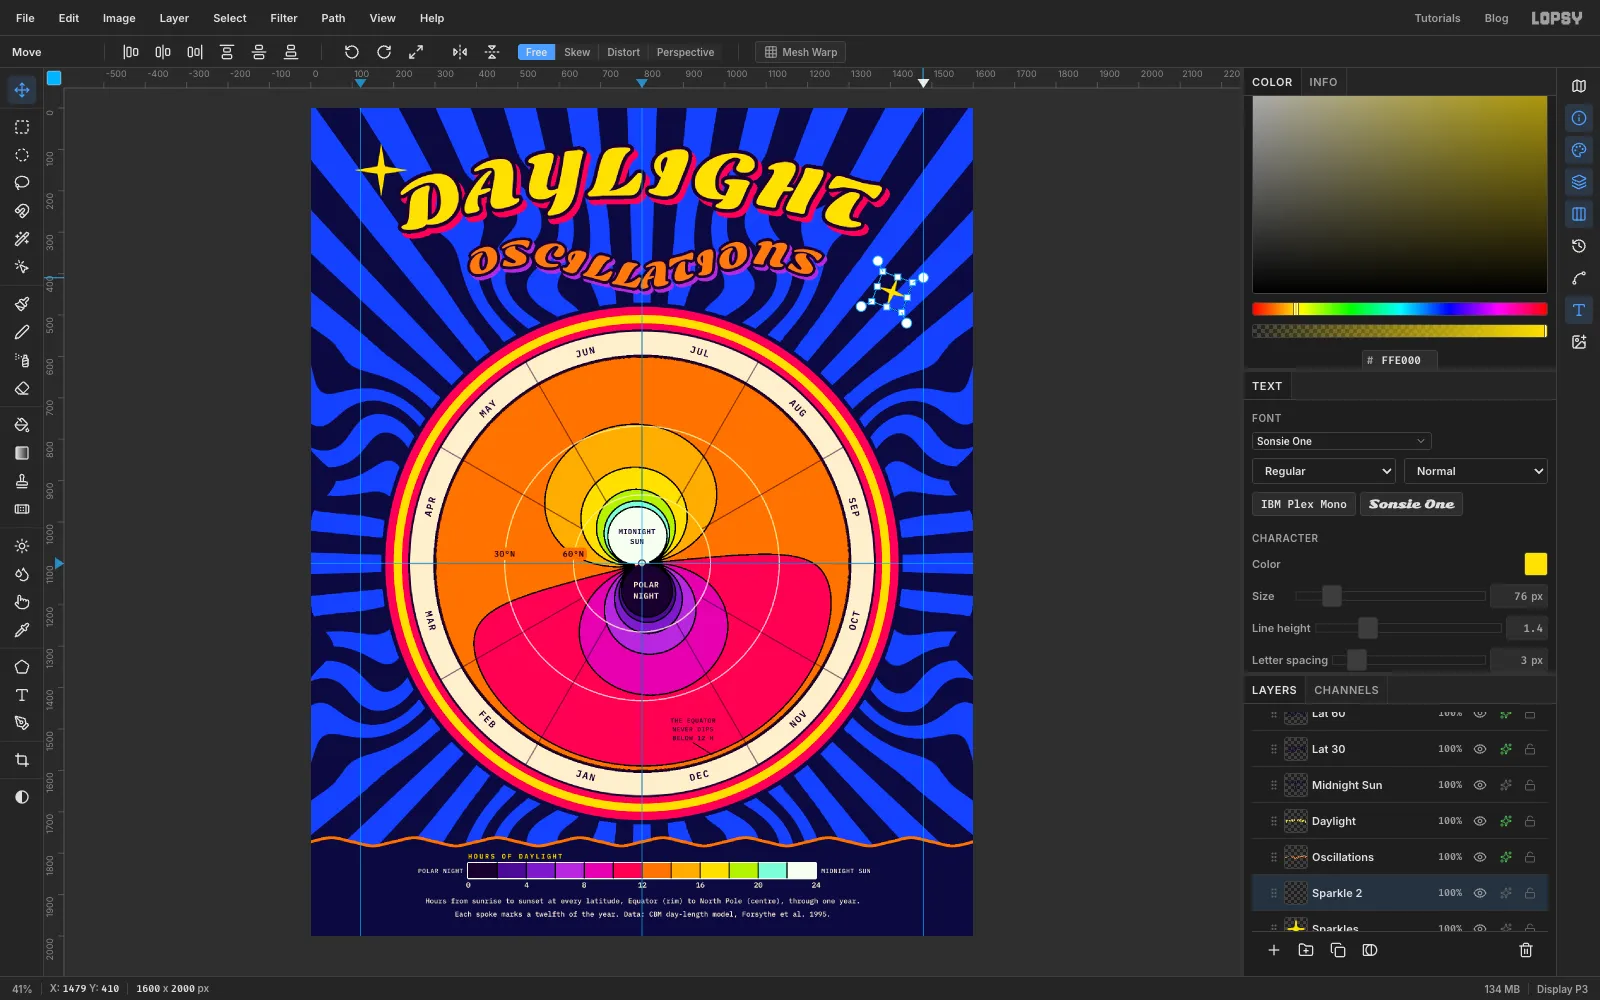
Tilt two of the copies so the sparkles don't look stamped. Click the layer of the copy at 1430, 470. Pick the Rectangular Marquee (M), draw a box just around it, switch to the Move tool (V) and drag the rotate handle outside its top-right corner by about 20°. Press Cmd+D. Then click the layer of the copy at 150, 560 and do the same, by about −15°.
-
Merge and outline the sparkles
Click the top sparkle copy and choose Layer → Merge Down three times. All four end up on
Sparkles. Give the layer the same treatment as the title: a Stroke of Width5in , and a Drop Shadow of Offset X6, Offset Y7, Blur0, Opacity100, colour .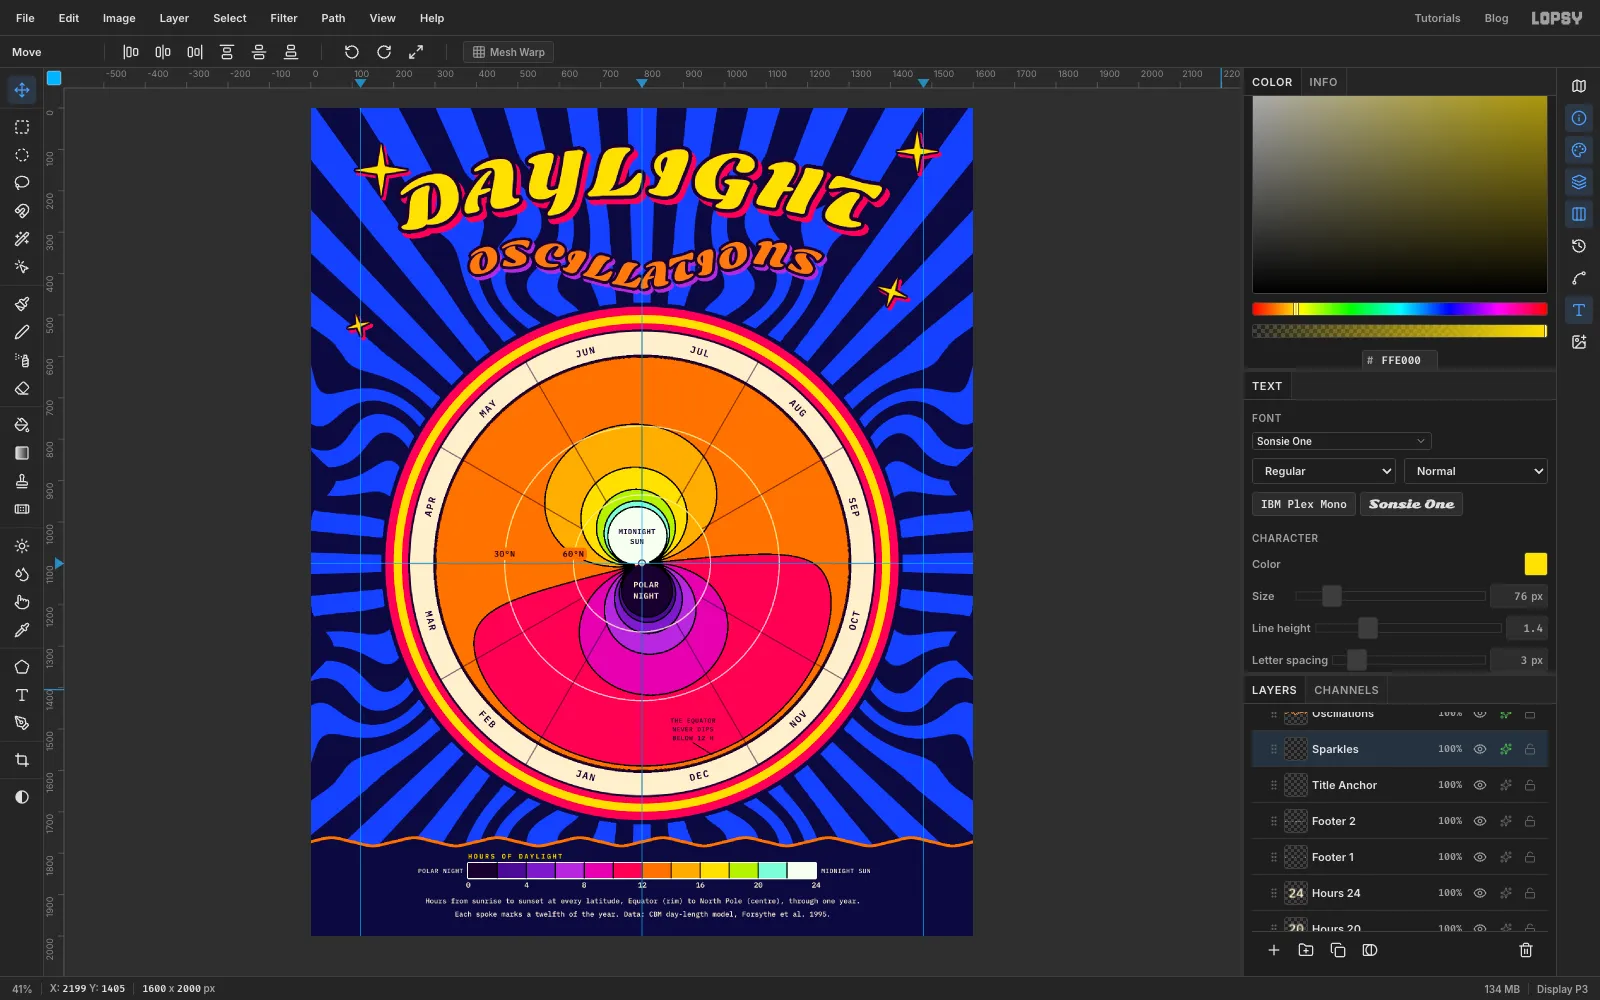
-
Outline the rays in hot pink
Click
Layer 1, the empty layer you never used, and delete it with the bin button.Click
Raysand add a Stroke of Width6in . Pink against cobalt has nearly the same brightness, so the edge shimmers. That's the vibrating colour trick the 1960s poster artists loved.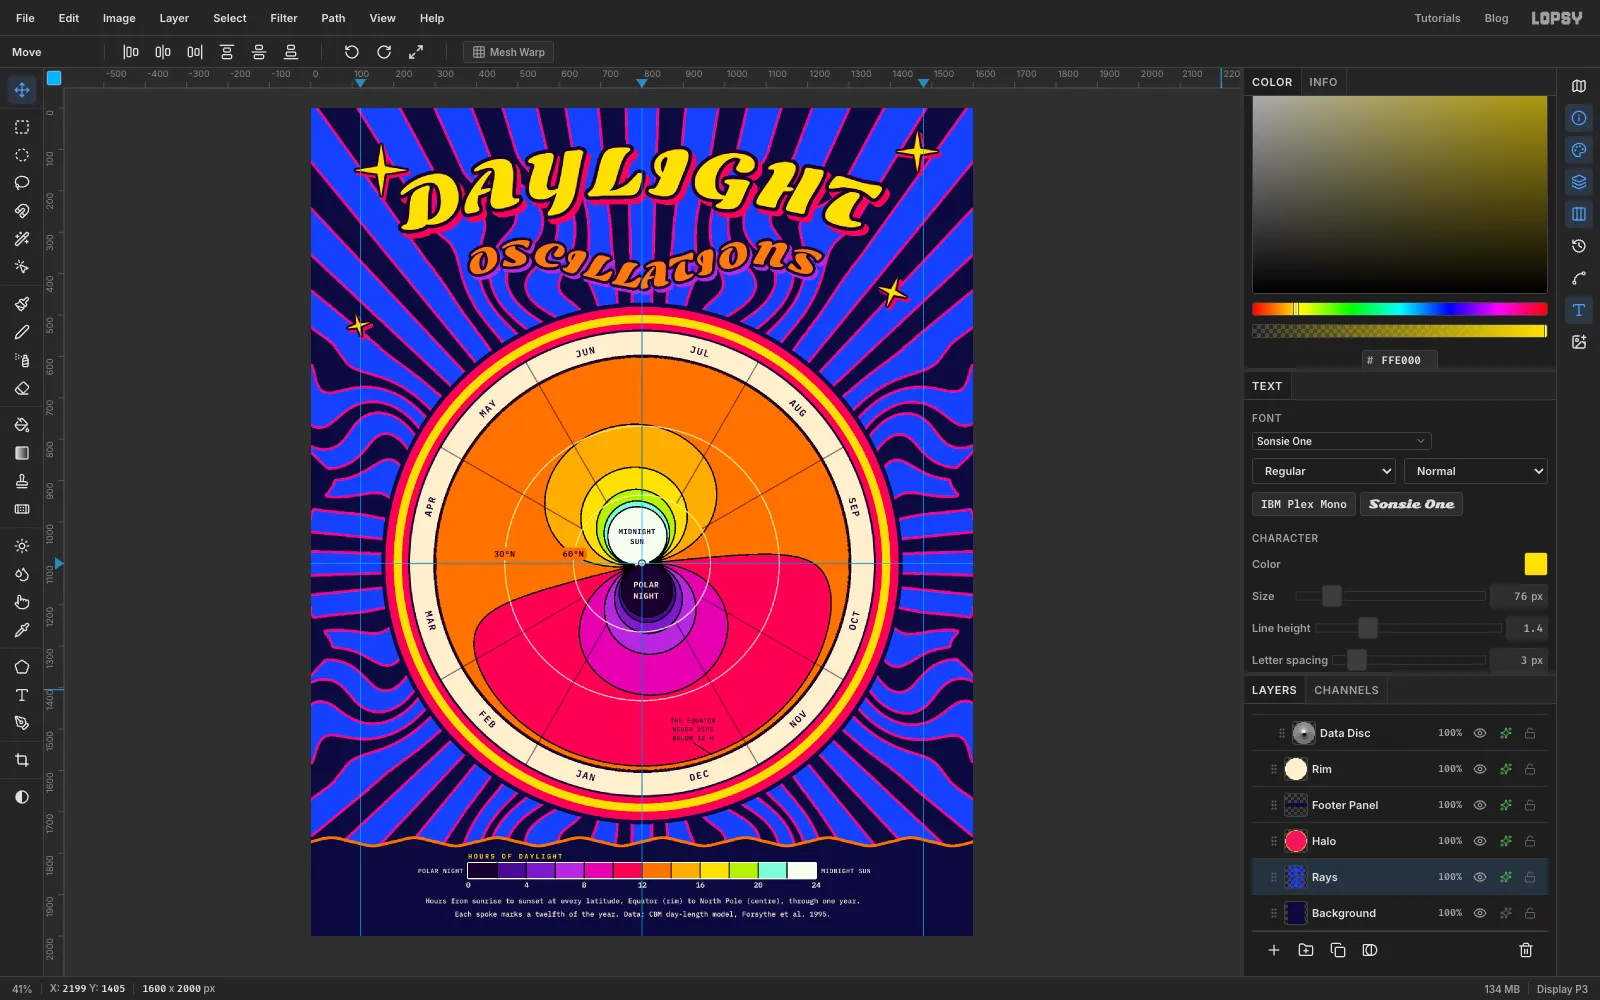
-
Add grain over everything
Click the first layer under
Projectat the top of the Layers panel (the first month name you made), then Add Layer. Name itGrain. Press Cmd+D, set the foreground to and choose Edit → Fill.Choose Filter → Add Noise…, set Amount to
22, and click Mono and Gaussian. Click Apply. Set the layer's Blend to Overlay and its opacity to45%. Mid grey disappears in Overlay, so only the speckle shows, like ink on rough paper.Save your work with File → Save Project, and export with File → Quick Export PNG.